Download

1 / 18
180 likes | 310 Views
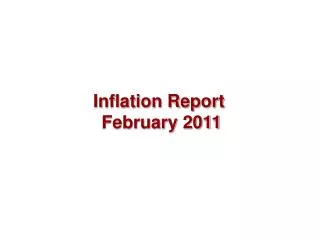
Inflation Report May 2011. Money and asset prices. Chart 1.1 Bank Rate and forward market interest rates (a). Sources: Bank of England and Bloomberg.

E N D
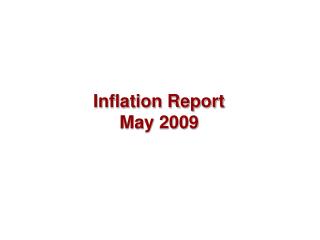
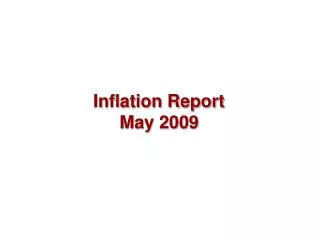
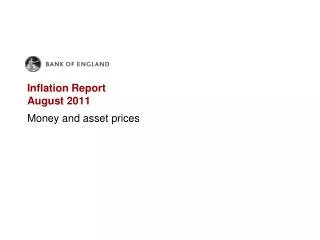
Inflation Report May 2011 Money and asset prices
Chart 1.1 Bank Rate and forward market interest rates(a) • Sources: Bank of England and Bloomberg. • (a) The February 2011 and May 2011 curves are estimated using OIS rates in the fifteen working days to 9 February2011 and 4 May 2011 respectively.
Chart 1.2 Indicators of market uncertainty Sources: Bloomberg, Chicago Mercantile Exchange, NYSE Euronext and Bank calculations. (a) Three-month option-implied volatility for FTSE 100. (b) Three-month option-implied volatility for West Texas Intermediate crude oil. (c) Average of three-month option-implied volatilities for sterling-US dollar and sterling-euro exchange rates. (d) Three-month option-implied volatility for three-month Libor, as annual change in basis points.
Chart 1.3 Selected European ten-year spot government bond spreads(a) Sources: Bloomberg and Bank calculations. (a) Spread over ten-year German government bond yield.
Chart 1.4 UK five-year nominal spot gilt yields and five-year yields, five years forward(a) Sources: Bloomberg and Bank calculations. (a) Zero-coupon yield. (b) Derived from the Bank’s government liability curves.
Chart 1.5 International equity prices(a) Source: Thomson Reuters Datastream. (a) In local currency terms.
Chart 1.7 Write-off rate on lending to PNFCs and corporate liquidations rate Sources: Bank of England, Companies House, The Insolvency Service, ONS and Bank calculations. (a) Write-off rate on lending by UK monetary financial institutions to private non-financial corporations (PNFCs). The series has been calculated as annualised quarterly write-offs divided by the corresponding loans outstanding at the end of the previous quarter, and is expressed as a four-quarter moving average. Lending is in both sterling and foreign currency, expressed in sterling terms. Non seasonally adjusted. (b) Calculated as the total number of corporate liquidations in the previous four quarters divided by the average number of active registered companies over that period. Since the Enterprise Act in 2002, a number of administrations have subsequently converted to creditors’ voluntary liquidations. These are not included in the data. Data relate to England and Wales.
Chart 1.8 Term issuance by the major UK lenders in public markets(a) Sources: Bank of England, Dealogic and Bank calculations. (a) Data are as at end-April 2011. Data are shown at a quarterly frequency, the final observation is 2011 Q1. Includes debt issued by Banco Santander, Bank of Ireland, Barclays, Co-operative Financial Services, HSBC, Lloyds Banking Group, National Australia Bank, Nationwide, Northern Rock and Royal Bank of Scotland. Term issuance refers here to securities with an original contractual maturity or earliest call date of at least 18 months. It includes subordinated lower Tier 2 and Tier 3 capital instruments with debt features. (b) Senior debt issued under HM Treasury’s Credit Guarantee Scheme.
Chart 1.9 Bank Rate and an estimate of marginal funding cost Sources: Bank of England, Bloomberg, British Bankers’ Association, Markit Group Limited and Bank calculations. (a) The estimated marginal funding cost of extending variable-rate sterling-denominated loans. This is calculated as the sum of three-month Libor plus a weighted average of the five-year CDS premia of the major UK lenders (Barclays, HSBC, Lloyds Banking Group, Nationwide, Northern Rock, Royal Bank of Scotland and Santander UK). For April 2011 the weights are held fixed at March 2011 values. Marginal funding costs may vary across lenders. Lenders with a greater proportion of retail funding may consider the cost of deposits when setting their marginal funding cost.
Chart 1.10 PNFCs’ net external finance raised(a) (a) Includes sterling and foreign currency funds. (b) Non seasonally adjusted. (c) Includes stand-alone and programme bonds. (d) As component series are not all seasonally adjusted, the total may not equal the sum of its components.
Chart 1.11 Credit Conditions Survey: spreads on corporate lending by company size(a) (a) Weighted responses of lenders. A positive balance indicates that spreads over reference rates have fallen and a negative balance indicates spreads have risen. (b) Data are only available from 2009 Q4.
Chart 1.12 Net secured lending and regular and other lump-sum repayments of secured lending
Chart 1.13 Two-year fixed quoted mortgage rates(a) (a) Sterling-only end-month averages. Series are currently compiled using data from up to 23 UK monetary financial institutions, and are non seasonally adjusted. (b) Series finishes in April 2008, as thereafter only two or fewer products have been offered. (c) Series is only available on a consistent basis back to May 2008, and is not published for March-May 2009 as only two or fewer products were offered in that period.
Chart 1.14 Broad money and nominal GDP (a) Recessions are defined as at least two consecutive quarters of falling output (at constant market prices) estimated using the latest data. The recessions are assumed to end once output began to rise. (b) The series is constructed using headline M4 growth prior to 1998 Q4, and M4 growth excluding intermediate OFCs thereafter. Intermediate OFCs are: mortgage and housing credit corporations; non-bank credit grantors; bank holding companies; and those carrying out other activities auxiliary to financial intermediation. Banks’ business with their related ‘other financial intermediaries’ is also excluded, based on anecdotal information provided to the Bank of England by several banks. The latest observation is 2011 Q1. (c) At current market prices. The latest observation is 2010 Q4.
Chart 1.15 Sectoral broad money(a) (a) Monthly data, unless otherwise specified. (b) Based on quarterly data. Intermediate OFCs are defined as in Chart 1.14.
Table 1.A Housing market indicators Sources: Bank of England, Department for Communities and Local Government, Halifax, HM Revenue and Customs, Land Registry, Nationwide, Royal Institution of Chartered Surveyors (RICS) and Bank calculations. (a) Averages of monthly data. (b) Except for property transactions, which is an average since April 2005, and Department for Communities and Local Government house prices, which is an average since March 2002. (c) All series are net percentage balances unless otherwise stated. (d) Number of residential property transactions with value £40,000 or above. (e) Loan approvals for house purchase. (f) Compared with the previous month. (g) Growth on a month earlier. (h) The published Halifax index has been adjusted in 2002 by Bank staff to account for a change in the method of calculation. (i) Data relate to England and Wales only.