
EXAMPLE 1
EXAMPLE 1. Making a Scatter Plot. NASA. NASA’s Crawler Transporter is a large vehicle that moves the space shuttle and its launch platform to the launch pad. The crawler uses about 126 gallons of fuel to travel 1 mile.

EXAMPLE 1
E N D
Presentation Transcript
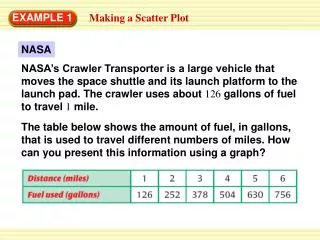
EXAMPLE 1 Making a Scatter Plot NASA NASA’s Crawler Transporter is a large vehicle that moves the space shuttle and its launch platform to the launch pad. The crawler uses about 126 gallons of fuel to travel 1 mile. The table below shows the amount of fuel, in gallons, that is used to travel different numbers of miles. How can you present this information using a graph?
Plot the ordered pairs from the table. EXAMPLE 1 Making a Scatter Plot Make a scatter plot of the data given above. SOLUTION STEP 1 (1, 126), (2, 252), (3, 378), (4, 504), (5, 630), (6, 756) Label the horizontal and vertical axes. STEP 2 Put Distance(mi) on the horizontal axis and Fuel used (gal) on the vertical axis.
1. for Example 1 GUIDED PRACTICE Make a scatter plot of the data.
2. for Example 1 GUIDED PRACTICE Make a scatter plot of the data.


