Download
1 / 23
230 likes | 389 Views
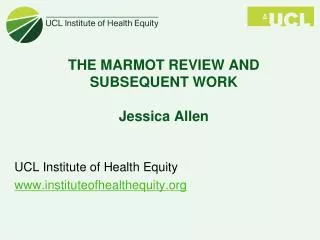
Institute of Health Equity Jessica Allen Jessica.allen@ucl.ac.uk www.instituteofhealthequity.org. Male life expectancy at birth, local authorities 2008-10. Inequalities in male life expectancy within local authority areas, 208-2010. Largest inequalities Smallest inequalities

E N D
Institute of Health Equity Jessica Allen Jessica.allen@ucl.ac.uk www.instituteofhealthequity.org
Inequalities in male life expectancy within local authority areas, 208-2010 Largest inequalities Smallest inequalities Westminster 16.9 (84) Barking & Dagenham 5.2 (77) Stockton-on-Tees 15.3 (78) Newham 5.0 (76) Middlesbrough 14.8 (76) Isle of Wight 4.9 (79) Wirral 14.6 (77) Herefordshire Cty UA 4.8 (79) Darlington 14.6 (77) Wokingham 3.5 (82) Newcastle -u-Tyne 13.7 (77) Hackney 3.1 (77) Figures in parentheses show life expectancy of the area
Fair Society, Healthy Lives (Marmot Review) • Health inequalities are not inevitable or immutable • Health inequalities result from social inequalities - ‘causes of the causes’ – the social determinants • Focusing solely on most disadvantaged will not be sufficient - need ‘proportionate universalism’ • Reducing health inequalities vital to economy - cost of inaction
Cost of Inaction In England, dying prematurely each year as a result of health inequalities, between 1.3 and 2.5 million extra years of life. Cost of doing nothing productivity losses of £31-33B reduced tax revenue and higher welfare payments of £20-32B increased treatment costs well in excess of £5B.
The social determinants of health and health and wellbeing boards • Focus on: • Giving every child the best start in life • Enabling everyone to have control over their lives • Ensuring a healthy standard of living for all • Creating and developing healthy sustainable places and communities • Strengthening the role and impact of ill health prevention
Policy Objectives: The Social Determinants of Health • Give every child the best start in life • Enable all children, young people and adults to maximise their capabilities and have control over their lives. • Create fair employment and good work for all • Ensure a healthy standard of living for all • Create and develop healthy and sustainable places and communities • Strengthen the role and impact of ill-health prevention
Children achieving a good level of development at age five, local authorities 2011
100 90 80 70 60 Quintile 1 (low) Quintile 2 50 Quintile 3 Quintile 4 40 Quintile 5 (high) 30 20 10 0 Read to every day (36 months Read to every day (5 yrs)) Watches >3 hours TV per day Watches >3 hours TV Per day % of families reading to their children every day and level of TV viewing by socio –economic status Percent of families [i]Dearden L, Sibieta L and Sylva K (2011) The socio-economic gradient in early child outcomes: evidence from the Millennium Cohort Study. Longitudinal and Life Course Studies 2(1): 19-40.
Average affirmations and prohibitions per hour by socio-economic status in the US. Outcomes 13: More parents are regularly engaging positively with their children. Outcome 13 Source Hart B and Risely T R (2003) The early catastrophe: the 30 million word gap by age 3.
Areas for outcomes: • Development • Cognitive • Communication & language • Social & emotional • Physical • Parenting • Safe and healthy environment • Active learning • Positive parenting • Parent’s lives • Mental wellbeing • Knowledge & skills • Financially self-supporting 21 Proposed outcomes see page 8
Existing assets • Children’s centres • Early years workforce • Health workforce • Mapping assets • Costs of doing nothing
Public health in local authorities • Partnerships • Cross sector • Intervene early • Make use of existing assets • Focus on inequalities • Health and well being
Institute of Health Equity Jessica Allen Jessica.allen@ucl.ac.uk www.instituteofhealthequity.org