Download
1 / 34
340 likes | 404 Views
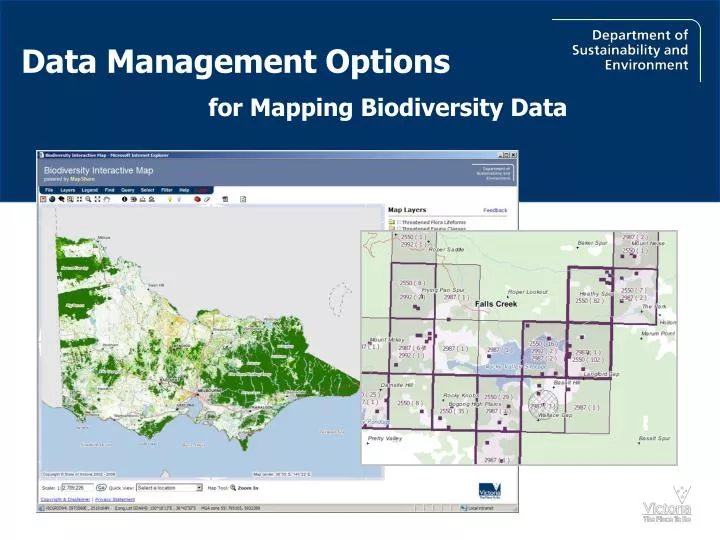
Introduction. DSE makes extensive use of browser based mapping technologies to support both intranet and internet business requirements. One of the environments used is a set of shared web mapping and spatial database components collectively known as MapShare.

E N D
Introduction DSE makes extensive use of browser based mapping technologies to support both intranet and internet business requirements. • One of the environments used is a set of shared web mapping and spatial database components collectively known as MapShare. • MapShare sites deliver dynamically generated custom maps from authoritative corporate data to internal and external users. • Several MapShare sites deal with natural resource and biodiversity data. • The complexity and size of some of the datasets plus the diversity of user requirements, skills and privileges pose specific challenges in implementing web mapping applications.
Context Solutions to spatial data presentation problems need to be achieved within the constraints of the current web mapping environment. • Vector spatial data is stored in Oracle/SDE. • Imagery is stored in an ER Mapper Image Web Server environment (IWS). • ArcIMS is used to retrieve data from Oracle and generate a map image. • Internet Mapping Framework (IMF) is used to configure the browser interface and combine the images from ArcIMS and IWS. • MapShare extensions to IMF are used to add additional functionality as required to specific MapShare sites.
Ecological Vegetation Classes Challenge: • Statewide polygon dataset of several million features. • Around 600 EVC classes to symbolise. • Need to show potentially small areas of interest in a broad context. Approach: • Overlay EVC polygons over three standard grids covering the State. • 10 minute, 5 minute and 1 minute grids for use at different scales. • Provide filter tool so users can show general location of specific EVCs. • Apply a spatial query based on polygon size at selected scales to limit the number of features retrieved to less than 5000.
Filter Builder allows user controlled conditional display of features in a layer Ecological Vegetation Classes Filter Builder
Ecological Vegetation Classes • Put slide showing EVCs at detailed polygon scale for one of the cells in the previous slide and include identify window.
Native Vegetation Extent Challenge: • Statewide polygon dataset of over 5 million features but few classes. • Need to show complete dataset at statewide extent. Approach: • Static high resolution image of the layer was created for use at all scales served from IWS and merged into browser by IMF. • Needed to develop suitable generic map base to support this technique. • Created simplified source dataset for use at small scales by aggregating attribute classes, filtering small features and generalising linework.
Threatened Species Challenge: • Point datasets involving hundreds of thousands of individual records. • Need to show occurrence of species or groups in a broad context. • Locational accuracy needs to be deliberately blurred for public viewing. • Widely varying currency and accuracy needs to be visible to expert users.
Threatened Species Approach: • Overlay point data on the 10, 5 and 1 minute grids to generate 3 tables with a many to one relationships to the corresponding grid. • Summarise data so that a record associated with a grid cell represents a summary of all the recordings of a species for that cell. • Develop a separate polygon layer to represent point record accuracy. • Present data as independent sub groups (eg: reptiles) to limit clutter. • Enhance Filter Builder to work on group of 5 layers as one logical entity and support multiple filters in effect at same time. • Devise grid rendering method to reflect variety and quantity of data. • Add authentication module to restrict access to detailed information.
Threatened Species Add in image with point data removed
Threatened Species Add in image below 1:30000
Conclusions • a lot of performance and functional benefits can be gained from careful consideration of the form in which spatial data is stored and then rendered in web mapping applications. • a range of solutions are required to deal with spatial datasets that have significantly different characteristics. • web mapping applications provide us with opportunities to communicate complex spatial information to users in ways not possible with traditional static maps.
DSE MapShare Sites Internal External • Biodiversity Interactive Map a a • Crown Land Managera • Recreation Facilities Database a • Catchment Information Mappera a • Fireplan a • Forest Explorer Online a • Native Vegetation Tracker a • Firemapa • Victorian Water Resources a • Index of Wetland Conditiona
MapShare Functionality • Zoom in, zoom out and pan around the map covering all of Victoria. • Control the visibility of spatial data to create a custom map. • Identify features in the map to display their attributes. • do queries on related databases (including metadata). • link (hyperlink) to other data sources (eg: photographs). • add freehand text and linework to a map as ‘markup’. • create custom maps as PDF documents from a list of set format options. • Export data in formats such as excel tables and shapefiles.
Toolbar Navigation - zoom, pan Locate and identify features Markup tools Measure Export, print and save MapShare Functionality
MapShare Functionality Table of contents Toggle between layer list and legend in the key area
Folders - Click to open or close Layer - may be scale dependent (grey box) - click for metadata Labels on/off (for some layers) Zoom to layer scale threshold (for some layers) MapShare Functionality Layer functions
Markup tools for drawing shapes or text MapShare Functionality Markup function
Find by location Select a region MapShare Functionality Quick views
MapShare Functionality Downloadable layers - only available some sites
Upload a shapefile to the current session Browse for relevant files Set symbols and order of drawing MapShare functionality... Upload your shapefile (selected sites)