Download
1 / 12
120 likes | 226 Views
This program analyzes NDVI field rates and calibration ramps. Learn how to measure, analyze, and save data for optimum results. Includes detailed instructions for setting up and running the program efficiently.

E N D
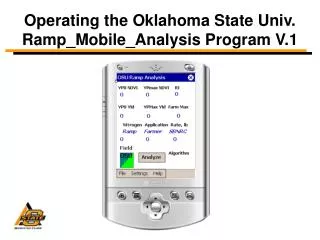
Operating the Oklahoma State Univ. Ramp_Mobile_Analysis Program V.1
NRich NDVI Field Rate NDVI Ramp Max or Upper Limit N Application Rate YPMax YP0 Idealized 16 Step Calibration Ramp
Which Part of the Ramp Do We Measure? Do Not Sense Sense
Preliminaries Analyzed Ramp Output Files *.txtSave in My Device, My Documents, Ramp Analyzed Files Start Icon for Ramp Mobile Analysis program Found under Programs Keep your HP Ipaq computer battery charged. This program along with the Microsoft program “.Net 2 Compact Framework” are stored in RAM. If the battery runs down, you will need to download “.Net 2 Compact Framework” from Microsoft, copy and install “Ramp Mobile Analysis” from our website and recreate the file structure. Ramp Configuration Files *.datFound under My Device, My Documents, Ramp Config Files NTech Capture Sensed Ramp Files *.txtStore in My Device, My Documents, Ramp Sensed Files There is a routine in the program to screen false triggers, but it will not screen out false triggers held longer than three seconds.
Instructions are located under the Help, How to Run Program menu commands Return to the main form. Basic Instructions on How to Run the Calibration Ramp Analyzer Program
You will need to load a ramp configuration file before you can analyze the data. There are two OSU ramp configuration files loaded on your computer: a) the “2006 16_Step Ramp.dat” for the 170 ft ramps and b) the “2006 8_Step Ramp.dat” file for the 90 ft long ramps. If you are sensing a ramp not created by the OSU ramp applicators you will need to create and save a ramp configuration file. Load or Create a Ramp Configuration
16 4 39.9 After entering the ramp step number and the step N • 1 0 2 13.3 3 26.6 After entering all of the values for the ramp steps, save the ramp configuration file. Saving the file will also load it into the program. Listing of ramp numbers and rates entered into the program You can return to the main form at any time Creating Ramp Configuration Files If you are using a ramp not created by the OSU ramp applicators, you will need to use this form to create a ramp configuration file.
Enter a field ID that everyone can understand. Number of Growing Degree Days from planting to one day prior to the sensing date. GDD can be obtained from the “NUE.Okstate.edu” web site 110 The farmer or land owner estimate of the maximum likely yield in bu/ac. 60 0.60 Expected Nitrogen Use Efficiency. The default is 0.60. Normally, do not change this value. Select either the high early season growth or the normal growth algorithm. The normal growth algorithm is the standard algorithm. Field Settings
Prior to analyzing the data you must load an NTech Capture sensed ramp data file. After you have completed your analysis of each field, save the output file to your computer. You can load and analyze more than one field before exiting the Ramp_Mobile_Analyzer program. File Menu
NRich NDVI Field Rate NDVI Max. Yield (bu/ac) calculated with SBNRC from YPmaxNDVI Response Index =YP0 NDVI/ YPmax NDVI Yield (bu/ac) with no additional N calculated with SBNRC Farmer estimated maximum likely yield, bu/ac N Rate (lb/ac) calculated with SBNRC, using YPmax yield N Rate (lb/ac) calculated based on ramp NDVI measurements Avg. Fld. Field Identification Algorithm Used N Rate (lb/ac) calculated with SBNRC with max yield set by farmer Analyze Button MainForm – OSU Ramp Analysis Output
Calibration Ramp Analyzer Output You can examine this file by “Clicking” on it in File Explorer. Microsoft Word will display the output in a presentation similar to this.