Download
1 / 26
260 likes | 278 Views
This article discusses the role of tropospheric ozone as a climate gas and air pollutant and presents the argument for controlling methane emissions. It explores the impact of tropospheric ozone on climate forcing, radiative forcing, and its relationship with other pollutants. The article also highlights the inhomogeneity of climate response to ozone change and the potential for larger radiative forcing values than currently estimated. The effects of ozone on surface warming and the importance of controlling methane emissions are also discussed.

E N D
TROPOSPHERIC OZONE AS A CLIMATE GAS AND AIR POLLUTANT: THE CASE FOR CONTROLLING METHANE Daniel J. Jacob with Loretta J. Mickley, Arlene M. Fiore, Yaping Xiao
MILLENIAL TEMPERATURE TREND [Mann et al., 1999; adopted by IPCC 2001]
RADIATIVE FORCING AS INDEX OF CLIMATE FORCING Climate models (GCMs) indicate DTsurface= l DF wherel (climate sensitivity parameter) ranges from 0.3 to 1.4 K m2 W-1 depending on the GCM
RADIATIVE FORCING OF CLIMATE, 1750-PRESENT IPCC [2001] “Kyoto also failed to address two major pollutants that have an impact on warming: black soot and tropospheric ozone. Both are proven health hazards. Reducing both would not only address climate change, but also dramatically improve people's health.” (George W. Bush, June 11 2001 Rose Garden speech)
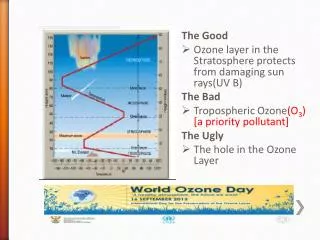
TROPOSPHERIC vs. STRATOSPHERIC OZONE NOx = NO + NO2: nitrogen oxide radicals VOC (volatile organic compounds) = light hydrocarbons and substituted organic compounds
TERRESTRIAL RADIATION OBSERVED FROM SPACE Scene over Niger Valley, northern Africa Ozone absorption feature at 9.6 mm; pressure-broadened in troposphere Ozone also has “shortwave forcing” by absorption of solar UV radiation
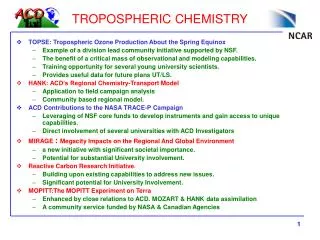
GLOBAL BUDGET OF TROPOSPHERIC OZONE Tropospheric ozone is the primary source of OH, the main atmospheric oxidant Global sources and sinks, Tg O3 yr-1 (GEOS-CHEM model) O2 hn O3 STRATOSPHERE 8-18 km TROPOSPHERE hn NO2 NO O3 hn, H2O OH HO2 H2O2 Pacman of the atmosphere! Main sink for CH4 Deposition CO, CH4, VOC
NOx EMISSIONS (Tg N yr-1) TO THE TROPOSPHERE NOx is the limiting precursor for tropospheric ozone formation STRATOSPHERE 0.2 LIGHTNING 5.8 FOSSIL FUEL 23.1 SOILS 5.1 BIOMASS BURNING 5.2 BIOFUEL 2.2 AIRCRAFT 0.5
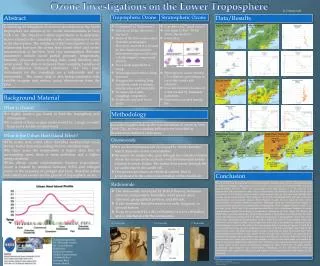
Lifetime is < 1 wk in surface air, several wks in free troposphere GLOBAL DISTRIBUTION OF TROPOSPHERIC OZONE Climatology of observed ozone at 400 hPa in July from ozonesondes and MOZAIC aircraft (circles) and corresponding GEOS-CHEM model results for 1997 (contours). GEOS-CHEM tropospheric ozone columns for July 1997 Li et al. [2001]
CURRENT GENERATION OF OZONE MODELS (IPCC) UNDERESTIMATES OZONE RISE IN 20th CENTURY Preindustrial ozone models } Observations at mountain sites in Europe [Marenco et al., 1994]
RADIATIVE FORCING BY TROPOSPHERIC OZONE COULD THUS BE MUCH LARGER THAN IPCC VALUE Global simulation of late 19th century ozone observationswith the GISS GCM Standard model: DF = 0.44 W m-2 “Adjusted” model (lightning and soil NOx decreased, biogenic hydrocarbons increased): DF = 0.80 W m-2 [Mickley et al., 2001]
RADIATIVE FORCING FROM TROPOSPHERIC OZONE Annual mean values: note heterogeneity Mickley et al. [1999] DF = 0.46 W m-2 How good is radiative forcing as an indicator of climate change, when forcing is so heterogeneous?
equilibrium climate DT = 0.3oC GISS GCM ANALYSIS OF CLIMATIC RESPONSE TO TROPOSPHERIC OZONE CHANGE OVER 20th CENTURY GCM equilibrium simulation for present-day climate with present vs. preindustrial tropospheric ozone; sea surface temperatures allowed to respond DF = 0.46 W m-2 present-day ozone Preindustrial ozone L.J. Mickley, Harvard
INHOMOGENEITY OF CLIMATE RESPONSE TO OZONE CHANGE OVER 20th CENTURY • Greater warming in northern hemisphere (due to more ozone and albedo feedback in Arctic) • Strong cooling in stratosphere: Stratospheric ozone Tropospheric ozone 9.6 mm Surface L.J. Mickley, Harvard
CLIMATE RESPONSE EXPERIMENTS WITH IDENTICAL GLOBAL RADIATIVE FORCINGS (0.46 W m-2) FROM: • Tropospheric ozone • Uniform tropospheric ozone (18 ppv) • Carbon dioxide (25 ppmv) • CO2 is a more effective warming agent at surface • In lower stratosphere, CO2 causes warming while tropospheric ozone causes cooling L.J. Mickley, Harvard
LOWER STRATOSPHERIC COOLING FROM TROPOSPHERIC OZONE IS STRONGEST IN ARCTIC WINTER particularly sensitive region for recovery of ozone layer! GCM temperature change in lower stratosphere in DJF (oC) from increasing tropospheric ozone over 20th century L.J. Mickley, Harvard
WHY IS CO2 MORE EFFECTIVE THAN OZONE FOR SURFACE WARMING AT SAME RADIATIVE FORCING? Correlation of forcing with 500 hPa humidity in tropics (25N-25S) Ozone CO2 DFCO2 – DFO3 Overlap of CO2 and H2O bands causes CO2 forcing to shift poleward where ice feedback enhances warming L.J. Mickley, Harvard
GCM SURFACE WARMING PATTERNS (oC) FROM INCREASING TROPOSPHERIC OZONE OVER 20th CENTURY – JJA SURFACE Equivalent uniform CO2 Tropospheric ozone Difference (white = insignificant or high altitude) Largest warmings downwind of ozone source regions L.J. Mickley, Harvard
SURFACE OZONE IS THE #1 AIR POLLUTANT IN U.S. Mean # summer days (1980-1998) exceeding U.S. ozone air quality standard (84 ppbv, 8-hour average) EPA/AIRS data [Lin et al., 2001]
ANTHROPOGENIC ENHANCEMENT OF TROPOSPHERIC OZONE BACKGROUND IS A SIZABLE INCREMENT TOWARDS VIOLATION OF U.S. AIR QUALITY STANDARDS(even more so for European standards!) Europe (8-h avg.) Europe (seasonal) U.S. (8-h avg.) U.S. (1-h avg.) 0 20 40 60 80 100 120 ppbv preindustrial present background
SUMMER 1995 MEAN AFTERNOON OZONE IN SURFACE AIR Fiore et al. [2002] AIRS observations GEOS-CHEM model (r2 = 0.4, bias=3 ppbv) “Background ozone” produced outside the North American boundary layer contributes 15-35 ppbv to mean surface air concentrations in the model
50% NOx 2030 A1 2030 B1 50% CH4 50% CH4 50% NOx 2030 A1 2030 B1 1995 (base) 50% NMVOC 50% NMVOC Combined effects of future anthropogenic emission trendson U.S. ozone air quality and on global climate Ozone pollution Fiore et al. [2002]
Recent methane trend Historical methane trend HISTORICAL METHANE TRENDS AND IPCC PROJECTIONS IPCC projections All IPCC scenarios project increases in CH4 emissions over next 50 years – but can we try to decrease CH4 instead?
PRESENT-DAY EMISSIONS OF METHANE:ASIA IS A MAJOR SOURCE REGION Animals Landfills Wetlands Termites Soil sink Gas venting Gas leakage Coal mining Rice paddies Y. Xiao, Harvard Biomass burning
QUANTIFYING ASIAN SOURCES OF METHANE USING AIRCRAFT OBSERVATIONS OF ASIAN OUTFLOW NASA/TRACE-P mission, Feb-Apr 2001
TESTING a priori ASIAN METHANE SOURCE ESTIMATES WITH TRACE-P CORRELATIONS FOR CH4-C2H6-CO Y. Xiao, Harvard GEOS-CHEM vs. observed CH4: a priori Asian CH4 source too high by 25% GEOS-CHEM vs. observed C2H6/CH4: Coal mining CH4source likely too high