Download
1 / 34
340 likes | 432 Views
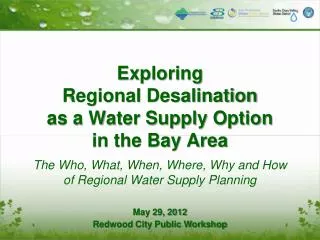
Exploring Regional Desalination as a Water Supply Option in the Bay Area. The Who, What, When, Where, Why and How of Regional Water Supply Planning. May 29, 2012 Redwood City Public Workshop. What is “Bay Area Regional Desalination”?

E N D
Exploring Regional Desalination as a Water Supply Option in the Bay Area The Who, What, When, Where, Why and How of Regional Water Supply Planning May 29, 2012 Redwood City Public Workshop
What is “Bay Area Regional Desalination”? Who are the agencies studying regional desalination in the Bay Area? Where would the water flow? Why are the partners studying desalination? How could it fit in with other options for the future? What has been done so far and what remains ahead? (When)
What is the Regional Desalination Project? • A partnership between some of the Bay Area’s largest water supply agencies. • A study to evaluate how a new water supply can move through our shared region, if and when it is needed.
Partners Together, our agencies serve over 5.6 million residents and businesses in the Bay Area. CCWD 120,00 acre-feet 500,000 people EBMUD 200,000 acre-feet 1.3M people Note: 1 acre-foot of water serves 2-3 families in one year Zone 7 48,000 acre-feet 200,000 people SFPUC 300,000 acre-feet 2.4M people 330,000 acre-feet 1.8M people SCVWD
Water Supply Planning Future Demand Future Supply
Use Less, Conserve More • Conservation is a priority: • grants, rebates, and other incentives • water-wise gardening and turf-conversion programs • leak and fixture audits • support of improved plumbing codes • public education • Current annual investments in conservation: $20M+ • Our agencies are also developing automated meter reading, improving leak detection and repair, and tracking down other system losses to manage demand.
Use Less, Conserve More By 2035, conservation savings are projected to be equivalent to the potable water needs of 400,000 households or about 1.2 million people.
Recycle and Reuse • EBMUD: 20 mgd of recycled water by 2040. • SCVWD: Evaluating the feasibility of using advanced treated recycled water for indirect potable reuse, such as groundwater recharge. • SFPUC: Requiring new commercial/mixed-use developments to reuse graywater and treat rainwater on-site. • Zone 7: Evaluating the expansion of recycled water to maximize its use for irrigation. • CCWD: 10% of existing supply is recycled water, evaluating new opportunities.
Recycle and Reuse By 2035, use of recycled water is projected to free up drinking water supplies for 160,000 households or nearly half a million people.
Acquire New Supplies May be needed to replace lost supplies or diversify portfolios. • Purchase imported water from other parties. • can be short-term or long-term agreements. • water conserved by agriculture is one potential source of water supply for growing urban populations. • Pump more groundwater. • Develop groundwater banking or conjunctive use programs. • Obtain/increase water rights for local streams . • Desalinate surface water or groundwater normally impaired for potable use.
Example of a Diversified Portfolio Santa Clara Valley Water District’s Existing Supply Mix 5
Potential Maximum Future Shortages (2030-2040) Dry Years Every Year Potential Future Shortages: 39,000 -217,000 acre-feet/year
Potential Agency Demands from Desalination Potential Future Shortages: 39,000-217,000
Regional Benefits • Diversification of Water Supplies • Reliability of Water Supplies • Minimization of New Facilities • Cost-Effectiveness • Operational Flexibility
Diversification of Water Supplies • Need different supplies that can handle different challenges. • Desalination offers unique benefits for responding to some of these challenges. What factors can affect our ability to reliably provide you with water? • drought conditions • earthquakes • levee failures in the Delta • major pipeline and facility failures • environmental restrictions • climate change • saltwater intrusion in the Delta • terrorist acts • water quality problems
Reliability of Water Supplies • Desalination provides a reliable source of drinking water, unlike other alternative supplies. • Desalination is not as dependent on hydrologic conditions. Can supply drinking water even during droughts.
Minimization of New Facilities • Regional approach minimizes the need for new construction and maximizes use of existing facilities. • Sharing of infrastructure leads to minimization of environmental footprint. • Environmental disruption due to plant construction would be limited to one site.
Cost-Effectiveness • Regional approach minimizes overall costs. • Costs (e.g., planning, design) will be shared among participating agencies. • A regional facility benefits from economies of scale. • Allows for use of existing excess capacities.
Operational Flexibility • Optimize regional desalination facility operation and capacity to meet different needs at different times. • Enhanced agency interconnections and agreements can provide flexibility in wheeling water across the Bay Area.
Timeline June 2013 Decision on agency participation and initiation of CEQA process (pending decision) 2007-2011 Pilot Study & Institutional Analysis 2011-2013 Site-Specific Analysis 2003-2004 Pre-Feasibility Study 2005-2007 Feasibility Study
Pre-Feasibility Study (2003-2005) • Identified project objectives and goals for each agency • Evaluated future demands based on historical needs, droughts • Identified and screened 22 sites => 13 feasible => top 3
Evaluation of Site Alternatives (2003-2007) Sites evaluated in 2003 feasibility study Narrowed down to 3 potential sites
Feasibility Study Findings • Project size could be optimized to meet most of the demand most of the time • Conveyance capacity limits the project size • If operated continuously, water costs could be cut by 50% • A series of institutional agreements will be required
Site Selection for Pilot Testing • East Contra Costa selected • Benefits: • Opportunity to add to body of research: testing of brackish water desalination • Permitted CCWD water intake (Mallard Slough Pump Station) • Existing facilities with state-of-the-art fish screen
Concluding Thoughts • The Bay Area Regional Desalination Project is a unique partnership offering regional benefits. • Desalination is one of many tools (including recycled water, conservation, groundwater, etc.) to address water shortages.
BARDP Alternative Delta Conveyance More expensive option Reduce Losses Size of circle is related to the potential amount of water available. Involves recycled water. Source: PRELIMINARY ESTIMATES from Zone 7 2011 Water Supply Evaluation
60 MGD = 0.8% per Year EBMUD’s Projected Shortfall • Population will increase in service area • Primarily infill and densification along Bay • Slightly less than August 2009 ABAG projection
Projected Demands, Supplies, and Potential Maximum Shortages (2030-2040) Dry Years Normal Years Potential Future Shortages: 39,000 -217,000 acre-feet/year