Download
1 / 3
30 likes | 118 Views
Detailed analysis of cumulative variance in EVM metrics for FY 2007 Q4, highlighting portfolio performance and investment reporting. Review of cost and schedule variances, with insights into eRulemaking, FinRS, and PRISM impacts.

E N D
Information Investment Subcommittee MeetingEVM SLIDE ONLYDecember 20, 2007
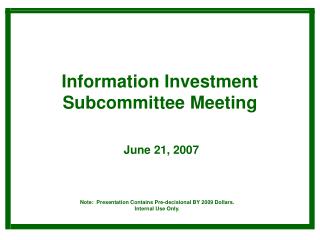
EVM Metrics – FY 2007 Q4 Cumulative Note: $ in thousands.
EVM and Portfolio Variance FY 2007 Q4 – Cumulative Variance Report 10 investments reporting Earned Value. 7 investments are within 10% cost and schedule variance 3 investments are not within 10% variance eRulemaking: -11.0% schedule variance due to CR and delay in receiving funds FinRS: -24.4% schedule variance due to contract award delay and bid protest PRISM: -11.4% schedule variance due to the planning for PRIA II legislation Portfolio performance outside acceptable variance Cost Variance (CV) = -0.4% Schedule Variance (SV) = -10.2%