Download
1 / 19
190 likes | 385 Views
The Thermodynamic Evolution of Recurving Tropical Cyclones. Clark Evans ASP Research Review 17 November 2010 With credit to: Bob Hart (FSU) and Heather Archambault (Univ. at Albany, SUNY). A Couple of Definitions…. “Recurving Tropical Cyclones”

E N D
The Thermodynamic Evolution of Recurving Tropical Cyclones Clark Evans ASP Research Review 17 November 2010 With credit to: Bob Hart (FSU) and Heather Archambault (Univ. at Albany, SUNY)
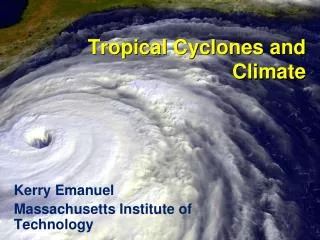
A Couple of Definitions… • “Recurving Tropical Cyclones” (aka “extratropically transitioning tropical cyclones”) Basic Definition: A cyclone that moves from the tropical and sub-tropical latitudes to the mid-latitudes. Extended Definition: A cyclone that transitions from a tropical cyclone into an extratropical (or frontal) cyclone (Jones et al. 2003). (Hurricane Floyd of 1999; Images courtesy Bob Hart, FSU)
Pressure (hPa) Time (UTC) A Couple of Definitions… Start End 2. “The Thermodynamic Evolution of Recurving Tropical Cyclones” Symmetric Component: The cooling of the tropical cyclone’s inner core during the extratropical transition (or ET) process. Right: Area-averaged (inside 500 km radius from the surface center) potential temperature (K; contoured) and temporally-integrated potential temperature change (K; shaded) of Atlantic Tropical Cyclone Bonnie between 1200 UTC 28 August 1998 and 0000 UTC 31 August 1998 from U.S. Navy operational forecast model (NOGAPS) analyses.
A Couple of Definitions… 2. “The Thermodynamic Evolution of Recurving Tropical Cyclones” Asymmetric Component: The transition from a symmetric, warm-core to an asymmetric, cold-core thermal structure (for most ET cases). End of ET Start of ET Right: Cyclone phase space (Hart 2003) evolution of Atlantic Tropical Cyclone Bonnie between 1200 UTC 28 August 1998 and 0000 UTC 31 August 1998 as diagnosed by analyses obtained from the U.S. Navy’s operational forecast model (NOGAPS).
Why Do We Care? • Impacts a number of structural evolutions of the transitioning cyclone, including the wind field structure (e.g., Evans and Hart 2008) and vertical distributions of static stability and potential vorticity. • The sensible weather expected from post-tropical cold-core and warm-seclusion cyclones can be quite different! Better understanding of this evolution can lead to better forecasts. • Thermodynamic processes influence the downstream large-scale weather pattern, leading to forecast skill degradation and potential high-impact weather events well-removed from the cyclone.
Example: Wind Field Evolution K day-1 • Cooling preferentially near the center leads to the outward movement of the near-surface radius of maximum winds (RMW; Evans and Hart 2008). • Understanding how this cooling occurs may lead to a better ability to predict the expansion of the RMW (Fogarty et al. 2010). Above: Vertically-integrated, azimuthally-averaged temperature tendency (shaded; K day-1) between 0-500 km radius from the local of minimum sea level pressure as obtained from a 4 km simulation of the ET of TC Bonnie (1998). The solid black line represents the simulated radius of maximum 925 hPa tangential wind.
Example: Downstream Impacts Above: 40°–60°N 250-hPa meridional wind anomaly (shaded, σ) and magnitude of departure from climatology (solid, every 15 m s−1, zero line omitted). Data are from 0.5° Global Forecast System (GFS) and 2.5° NCEP/NCAR Reanalysis analyses. 6 9 Day in September 2010 X Track of Typhoon Malakas http://agora.ex.nii.ac.jp/digital-typhoon/ X Downstream Development Record Western U.S. Heat Heavy Eastern U.S. Rains Slide courtesy Heather Archambault, University at Albany (SUNY).
Methodology TD TS HU EX • Here, we conduct a case study of a representative ET event, Atlantic Tropical Cyclone Bonnie of 1998. • Similar to ~70% of recent Atlantic ET events (Hart et al. 2006) • Cold-core transition with decay after ET; minimal land interaction; no merger with another cyclone • A triply-nested (36/12/4 km) simulation is conducted using the Penn State/NCAR Mesoscale Model v5 (MM5). • Physics chosen as appropriate for TC and ET modeling studies • Track and intensity of Bonnie are reasonably well-simulated (Satellite image obtained from NOAA/OSEI)
Methodology Primary diagnostic tool: thermodynamic budgets Reasoning? We can understand how temperature is changing if we can quantify every possible means by which it changes! Horizontal advection Vertical advection Adiabatic processes Radiative processes Boundary layer processes Cumulus scheme(s) Diffusion Moisture (phase changes) Dynamical Terms Parameterized (Diabatic) Terms (Radiation image obtained from nasa.gov, boundary layer image from www.ral.ucar.edu/weather/.)
Results: Symmetric Evolution Cooling structure inside 500 km radius: vertical (left), radial (top right), temporal (bottom right) K day-1 K End Start Fields in panels at right are vertically-integrated. Fields in panels at left and lower right are area-averaged. Field in upper right panel is azimuthally-averaged.
Results: Symmetric Evolution Cooling structure inside 500 km radius: components Left: Area-averaged, temporally-integrated (to 0000 UTC 31 August 1998) temperature change (K) from selected thermodynamic budget components.
Results: Symmetric Evolution Tropical Phase Early-Stage ET Late-Stage ET Comparisons to hypotheses from previous studies Vag < 0 Microphysics Parameterized (residual) Upper Level Jet Advection Adiabatic Cooling Vag > 0 Convection (McTaggart-Cowan et al. 2003, their Figure 14) (Sinclair 1993, their Figure 10) • Sinclair (1993): horizontal advection as other terms largely offset • McTaggart-Cowan et al. (2003): horizontal advection in the right upper jet entrance region • Evans and Hart (2008): adiabatic cooling driven by inner core quasigeostrophic rising motion • Our findings: in the lower troposphere, primarily horizontal advection with some vertical redistribution
Results: Asymmetric Evolution Cyclone phase space evolution: lower and upper troposphere Lower Troposphere Thermal Wind vs. Thickness Lower Troposphere Thermal Wind vs. Upper Troposphere Thermal Wind
Results: Asymmetric Evolution • In the lower troposphere, the magnitude of the thickness asymmetry between the left-of-track and right-of-track hemisphere grows steadily through the model simulation. • The lower tropospheric warm-core structure of the cyclone is maintained well into the ET process before decaying starting near 0000 30 August 1998. • The upper tropospheric warm-core structure of the cyclone steadily decays and has transitioned into a cold-core structure shortly after 0000 UTC 30 August 1998. It continues to become increasingly cold-core in nature through the remainder of the model simulation. • Questions… • What influences the thickness asymmetry evolution? • What causes the warm-to-cold-core structural evolution?
Results: Asymmetric Evolution Thickness evolution: before ET and late in the ET process r = 500 km r = 500 km 1200 UTC 28 August 1998 ~ 4 K across vortex 1400 UTC 30 August 1998 ~ 10 K across vortex Further analysis is needed to determine why these fields evolve as they do. Use of quasi-LaGrangian trajectories in conjunction with thermodynamic budget output may provide insight. The role of vertical wind shear in creating these asymmetries (e.g., Jones 1995,2000) must also be considered in this context.
Results: Asymmetric Evolution Structural evolution: a hypothesis Steady erosion of upper-level warm-core The warm-to-cold-core structural evolution is hypothesized to be driven by vertical wind shear, eroding the vortex from the top-down (e.g., Frank and Ritchie 2001), and the atmospheric response to restore thermal wind balance as an upstream trough is superimposed upon the shallow remnant vortex and its environment.
Conclusions • The symmetric evolution appears to be driven largely by horizontal advective processes. Other processes play minor or redistributive roles. • Our findings most closely resemble the hypothesis of McTaggart-Cowan et al. (2003), particularly considering that the greatest cooling is found north of the vortex. Further analyses are needed, however, to quantify this. • The increasingly cold-core structure in the upper troposphere appears to coincide well with the decay of the vortex aloft, suggesting that the warm-to-cold-core structural evolution may be driven by vertical wind shear and thermal wind balance restoration with the vortex. • We’ve only started scratching the surface with respect to tying this evolution into the many factors that it potentially influences!
Future Work • Refine findings related to the asymmetric structural evolution using our simulation output and theory derived from previous works • Extend our methods to further cold-core and warm-seclusion ET cases and tie findings to forecasting the wind field evolution • Quantify uncertainty in the thermodynamic evolution to the selection of physical parameterizations, numerical model, and initial conditions • Quantify the adiabatic (dynamical) and diabatic (parameterized) contributions to the large-scale flow reconfigurations and downstream heat transport associated with ET events
References • Evans, C. and R. E. Hart, 2008: Analysis of the wind field evolution associated with the extratropical transition of Bonnie (1998). Mon. Wea. Rev., 136, 2047-2065, DOI 10.1175/2007MWR2051.1. • Fogarty, C., and coauthors, 2010: Forecasting Extratropical Transition. Proceedings, Seventh International Workshop on Tropical Cyclones, 15-20 November 2010. [Available online at ftp://ftp.bom.gov.au/pub/files/lev5el2/other/jdk/documentation.html]. • Frank, W. M., and E. A. Ritchie, 2001: Effects of vertical wind shear on the intensity and structure of numerically simulated hurricanes. Mon. Wea. Rev., 129, 2249-2269. • Hart, R., 2003: A cyclone phase space derived from thermal wind and thermal asymmetry. Mon. Wea. Rev., 131, 585-616. • Hart, R. E., J. L. Evans, and C. Evans, 2006: Synoptic composites of the extratropical transition lifecycle of North Atlantic tropical cyclones: factors determining post-transition evolution. Mon. Wea. Rev., 134, 553-578. • Jones, S. C., 1995: The evolution of vortices in vertical shear. I: initially barotropic vortices. Quart. J. Roy. Meteor. Soc., 121, 821-851. • Jones, S. C., 2000: The evolution of vortices in vertical shear. III: baroclinic vortices. Quart. J. Roy. Meteor. Soc., 126, 3161-3185. • Jones, S. C., and coauthors, 2003: The extratropical transition of tropical cyclones: forecast challenges, current understanding, and future directions. Wea. Forecasting, 18, 1052-1092. • McTaggart-Cowan, R., J. R. Gyakum, and M. K. Yau, 2003: The Influence of the downstream state on extratropical transition: Hurricane Earl (1998) case study. Mon. Wea. Rev., 131, 1910–1929. • Sinclair, M. R., 1993: Synoptic-scale diagnosis of the extratropical transition of a southwest Pacific tropical cyclone. Mon. Wea. Rev., 121, 941–960.