Download
1 / 1
10 likes | 112 Views
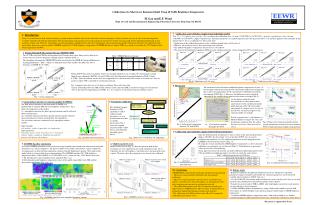
satellite. Atmosphere Emission. Atmosphere Extinction. Vegetation Emission. 1. 1. VIC 10cm soil moisture (%). 5 10 15 20 25 30 35 40 45 50 55. Vegetation Extinction. 2. 2. Soil Emission. Surface Refection. LW_H. LW_V. CF_H. CF_V. ER_H. ER_V.

E N D
satellite Atmosphere Emission Atmosphere Extinction Vegetation Emission 1 1 VIC 10cm soil moisture (%) 5 10 15 20 25 30 35 40 45 50 55 Vegetation Extinction 2 2 Soil Emission Surface Refection LW_H LW_V CF_H CF_V ER_H ER_V TMI 10.7GHz Tb(vertical) Modeled 10.7GHz Tb(vertical) (b) TMI observation compared with model output at July 15, 1999, 14:00UTC Vegtation cover 0.745 0.869 0.561 0.627 0.000 0.231 5 10 15 20 25 30 35 40 45 50 55 Vegetation water content (kg/m2) 0.998 0.750 0.101 1.000 0.004 0.833 SGP99 2.5cm soil moisture (%) Soil roughness (cm) 0.318 0.454 0.324 0.284 0.409 0.401 July 13~16 July 17~20 July 22~29 July 13~16 July 22~29 July 17~20 275 280 285 290 295 275 280 285 290 295 275 280 285 290 295 275 280 285 290 295 275 280 285 290 295 275 280 285 290 295 275 280 285 290 295 275 280 285 290 295 275 280 285 290 295 275 280 285 290 295 275 280 285 290 295 275 280 285 290 295 Modeled TbV(K) Modeled TbV(K) Validation Calibration Days calibrated Days tested TMI TbV(K) TMI TbV(K) TMI TbV(K) TMI TbV(K) July 22~29 July 13~16 July 17~20 July 17~20 July 13~16 July 22~29 275 280 285 290 295 275 280 285 290 295 275 280 285 290 295 255 260 265 270 275 280 285 290 255 260 265 270 275 280 285 290 255 260 265 270 275 280 285 290 270 275 280 285 290 270 275 280 285 290 270 275 280 285 290 255 260 265 270 275 280 285 290 255 260 265 270 275 280 285 290 255 260 265 270 275 280 285 290 Modeled TbH(K) Modeled TbH(K) Days tested Days tested Days calibrated Days calibrated TMI-H 220 230 240 250 260 270 280 290 TMI-H 220 230 240 250 260 270 280 290 TMI-H vs ESTAR TMI-H vs PSR-H 220 230 240 250 260 270 280 290 220 230 240 250 260 270 280 290 ESTAR PSR-H TMI-V 270 275 280 285 290 295 300 PSR-H 220 230 240 250 260 270 280 290 300 TMI-V vs PSR-V PSR-H vs ESTAR 220 230 240 250 260 270 280 290 300 270 275 280 285 290 295 300 ESTAR PSR-V Little Washita Central Facility El Reno V H 0.36kg/m2 TbV Tb (K) TbH 0.25kg/m2 0.20kg/m2 Soil moisture (%) Different vegetation water content 0.0~0.8 kg/m2 Different vegetation cover 0.0~1.0 160 180 200 220 240 260 280 300 165 185 205 225 245 265 285 0 5 10 15 20 25 30 35 40 45 50 0 5 10 15 20 25 30 35 40 45 50 Volumetric soil Moisture (%) Volumetric soil Moisture (%) TbH(K) TbH(K) Different soil roughness 0.02~0.2cm Different soil types TbH(K) TbH(K) 220 230 240 250 260 270 280 290 215 225 235 245 255 265 275 285 0 5 10 15 20 25 30 35 40 45 50 0 5 10 15 20 25 30 35 40 45 50 Volumetric soil Moisture (%) Volumetric soil Moisture (%) Calibration of a Microwave Emission Model Using 10.7GHz Brightness Temperature H. Gao and E.F. Wood Dept. of Civil and Environmental Engineering, Princeton University, Princeton, NJ, 08544 • 7. Calibration and validation (inputs from hydrology model) • Two 1 1(88 pixels) areas (see fig. 5 (b)) are chosen for calibration. Area 1 is from (35.5N,99W) to (36.5N,98W), a sparsely vegetated area. Area 2 is from (34N,96W) to (35N,95W), a highly vegetated area. The three parameters are calibrated pixel by pixel for the period July 13-16, and then applied to the remainder of the period (July 17-29) as a validation test. The results show: • Application of the calibrated parameters to the validation period works well for Area 2 • However, the results for Area 1 show increasing error with time. • The modeled brightness temperature (Tb) for Area 1 is biased low. • The errors in the horizontal component (TbH) are more significant than the vertical component (TbV) for both areas. 1. Introduction: There is a critical need in land surface hydrology to understand the feedback between the land surface and the atmosphere. Surface soil moisture may be one of the most important variables required to develop this information. The electromagnetic characteristics of wet soil make passive microwave remote sensing a good tool for operational monitoring of soil moisture at large scale. However, uncertainties in surface parameters complicate the retrieval of soil moisture when using emission models. This poster describes the calibration of the land surface microwave emission model (LSMEM) against the 10.7GHz brightness temperatures of TRMM Microwave Imager(TMI) for a drying event during the 1999 Southern Great Plains Experiment (SGP99). 2. Tropical Rainfall Measuring Mission (TRMM)/TMI The 10.7GHz data from TMI has distinguished itself from previous space borne passive microwave sensors because of its low frequency and high spatial resolution (Table 1). The algorithms developed for TRMM TMI will be transferred to the AMSR-E (Advanced Microwave Scanning Radiometer - EOS), which was launched successfully on May 4th, 2002. The lowest frequency of AMSR-E is 6.9 GHz. Modeled TbV(K) Table 1 TRMM Microwave Imager • During SGP99 data from two airborne microwave imaging radiometers are available: the electronically scanned thinned array radiometer (ESTAR, L-band,1.4GHz) and the Polarimetric Scanning Radiometer (PSR, C-band, 6.7GHz). Since the airborne sensors have been approved to be consistent with observations at research sites, they are used to evaluate TMI’s potential in soil moisture retrieval. • Fig. 1 compares these data sets at 1/8 degree resolution. The results show that: • Linear relationships between TMI and the airborne sensors infer that TMI is sensitive to changes of soil moisture; • Due to the relatively high frequency of TMI, it is less sensitive to soil moisture than the airborne sensors. Fig. 6 Calibration results for area 1 Fig. 7 Calibration results for area 2 8. Discussion The conjecture for the biased low modeled brightness temperatures in area 1 is that the input soil moisture from the VIC land surface model is biased high and this is shown by comparisons of VIC soil moisture with field measurements taken during SGP99 (Fig. 8). However, this difference can be explained somewhat by the variable drying processes that occur over depth (Fig. 9). S band L band 0-1 cm 0-5 cm Fig. 1 sensor comparisons As the depth at which the field measurements are taken from is more representative of the satellite penetration depth than that of the VIC data (which corresponds to a deeper layer), we can say that the VIC soil moisture inputs to the emission model are too high. For the vegetated area 2, soil moistures at different depths are largely the same, and the drying is moderate (Fig. 10), and so the bias seen in area 1 does not exist in area 2. 4. Parameter calibration 3. Land surface microwave emission model (LSMEM) The land surface microwave emission model (LSMEM) was implemented to simulate TMI observed brightness temperatures. Fig.2 shows the components of the model: (i) atmospheric emission (the direct upward emission and the reflected downward emission); (ii) vegetation emission (the direct upward emission and the reflected downward emission, both are attenuated by the atmosphere);. (iii) soil surface emission, attenuated by the atmosphere and the canopy; Frequency, incident angle Input variables Surfaceparameters Atmospheric forcing The Shuffled Complex Evolution (SCE) algorithm is used to calibrate model parameters, so as to match model emissions to satellite observations. Fig. 3 shows the coupled emission model (yellow boxes) and calibration algorithm (green boxes). S band L band 0-1 cm 0-5 cm LSMEM Parameters to be calibrated Modeled Brightness Temperature (Tb) Fig. 10 Time-series of truck mounted remotely sensed soil moisture and soil layer measurements From www.ghcc.msfc.nasa.gov/landprocess/lp_gbe.html Fig. 9 Soil moisture profiles during the dry down Fig. 8 Soil moisture comparison between VIC and SGP99 Input Variables: soil moisture, surface temperature, air temperature. Input parameters: Vegetation water content; Vegetation cover; Vegetation salinity; Surface roughness; Sand fraction and clay fraction; Soil density; Soil salinity. Tb from TMI Comparison Parameters calibration with SCE 9. Calibration and validation (inputs from field measurements) • Since the field measured soil moisture (2.5cm) is closer to the emission penetration depth at 10.7GHz, the data of July 13-16 at the three SGP99 sites are used to recalibrate the parameter sets. The calibrated parameters are then plugged into the LSMEM to do soil moisture retrieval (Fig.11). • By using the vertical and horizontal TMI brightness temperatures as observations for calibration, two parameter sets are derived (Table 2). The differences in parameter values may be due to the following: • Same input error from soil moisture can lead to different calibrated parameter errors; • The possibility of multiple parameters sets that can satisfy the same criteria. Fig. 2 Satellite observed emission Fig. 3 Flow chart of modeling and calibration 5. LSMEM baseline simulation A baseline LSMEM simulation is first carried out using standard values found in the literature for uncertain parameters (e.g. surface roughness). The input variables to the model (soil moisture, surface temperature, air temperature) are derived from simulations using the Variable Infiltration Capacity (VIC) land surface model which was forced with observed precipitation. The LSMEM simulated 10.7 GHz brightness temperatures from (33.0N,104.0W) to (37.5N,94.0W) at 1/8º, hourly for July, 1999. Results show that: 1. The drying process after rainfall has been simulated (Fig. 4 (a)) 2. Both the pattern and brightness temperature values of the model output differ from TMI satellite observation significantly (Fig. 4 (b), (c)). 6. Model sensitivity tests Model sensitivity tests (Fig. 5) show that accurate land surface parameters are very important to give good simulation results, this is especially true for soil roughness, vegetation cover and vegetation water content. Therefore, these three parameters are chosen to be calibrated. Table 2 calibrated parameters for SGP sites Fig. 11 Soil moisture retrieved from SGP sites Fig. 12 calibrated error due to input error 10. Conclusions 11. Future work • Repeat the calibration for different months/seasons to see whether the vegetation parameters change reasonably and whether the vegetation parameters can be related to available observed datasets (NDVI, LAI, etc.); • Use the TOPLATS land surface model soil moisture (with a top layer of 2.5cm) to see how much the error introduced by soil moisture profile can be reduced. • Transfer the current work of TMI to AMSR, with which higher sensitivity to soil moisture are expected due to lower frequency; • Validate AMSR brightness temperature by using a land surface model to upscale field observations to satellite footprint scale and then compare model output to AMSR brightness temperature; • Assimilate AMSR brightness temperatures into a land surface model to see whether assimilation improves model prediction of root zone soil moisture and surface energy fluxes. • TRMM/TMI has potential for monitoring soil moisture operationally; • Microwave emission model simulation calls for parameter calibration; • Microwave emission model sensitivity shows vegetation water content, vegetation cover and soil roughness are the parameters that affect outgoing emission most in soil moisture retrieval; • The calibrated parameters with VIC soil moisture provide great improvement to LSMEM results. However there an inconsistency in the depth of modeled and measured ‘surface soil moisture’; • The calibrations with different observation (H and V component) yield different parameter values. (a) LSMEM modeled 10.7GHz TbV at 8:00a. m. local time(14:00 UTC) of July 10, 20 and 30, 1999 TbH(K) TbH(K) 290 290 TMI Tb(K) TMI Tb(K) Area2, standard deviation=9.6K (34N,96W)~(35N,95W) Area1, standard deviation=12.0K (35.5N,99W)~(36.5N,98W) 280 280 250 260 270 280 290 270 280 290 300 Modeled Tb(K) (c) Scatter plots of the two areas on (b) Fig. 5 LSMEM sensitivity test results Fig. 4 LSMEM simulation with simplified parameter scheme This poster is supported by NASA