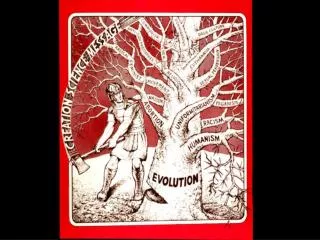
Information Graphic
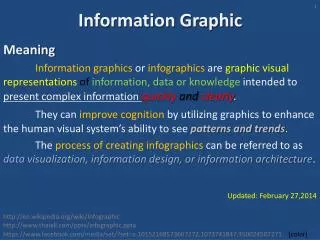
Information Graphic. Meaning Information graphics or infographics are graphic visual representations of information, data or knowledge intended to present complex information quickly and clearly .

Information Graphic
E N D
Presentation Transcript
Information Graphic Meaning Information graphics or infographics are graphic visual representations ofinformation, data or knowledge intended to present complex information quickly and clearly. They can improve cognition by utilizing graphics to enhance the human visual system’s ability to see patterns and trends. The process of creating infographicscan be referred to as data visualization, information design, or information architecture. Updated: February 27,2014 http://en.wikipedia.org/wiki/Infographichttp://www.thaiall.com/pptx/infographic.pptx https://www.facebook.com/media/set/?set=a.10152168573667272.1073741847.350024507271 [color]
https://www.facebook.com/photo.php?fbid=10152168785642272&set=pb.350024507271.-2207520000.1393033271https://www.facebook.com/photo.php?fbid=10152168785642272&set=pb.350024507271.-2207520000.1393033271 Color16 Million how https://www.facebook.com/photo.php?fbid=10152168619027272&set=pb.350024507271.-2207520000.1393033422. https://www.facebook.com/media/set/?set=a.10152168573667272.1073741847.350024507271
Powerpoint objectright clickFormat shape + Line Style + dash type Shadow + Transparency + DistanceShadow + inner + outer how
Powerpoint objectcurve shapeShape Fill + Shape OutlineBring to front + Send to back http://www.thaiall.com/office/doraemon_2007.pptx http://www.thaiall.com/office/remove_background.pptx https://www.facebook.com/photo.php?fbid=10151830569968895&set=pb.814248894.-2207520000.1393037207 how
1.ใช้ [ภาพคน] มาเป็นศูนย์กลางแล้วขยายความ [ตามตำแหน่ง]เช่น การพัฒนาอเมริกามีหลายมุม มองจากบนลงล่าง http://dupress.com/articles/infographic-making-america-smarter-stronger-and-younger/ how
2. ใช้ [เส้นเวลา] มาเดินเรื่องแล้วขยายความ [ตามเวลา]เช่น การพัฒนา Linux ในช่วง 20 ปีมีเหตุการณ์สำคัญจากซ้ายไปขวาคำสำคัญคือ Milestones http://mashable.com/2011/04/06/linux-20-anniversary/ how
ชวนมองภาพว่าเห็นอะไรในภาพชวนมองภาพว่าเห็นอะไรในภาพ • ประเด็นหลัก • การลำดับเรื่อง • ชี้ให้เป็นปัญหาที่กระชับ • เห็นวิธีแก้ไข • ภาพที่สื่อสารตามหัวข้อ • ออกแบบให้น่าอ่าน how https://www.facebook.com/photo.php?fbid=10152218223352450&set=a.385635862449.164151.359255107449
How to start with infographic? ? ? ? ? ? ? ? ? ? ? ? ? ? ? ? ? ? ? ? ? ? ? ? ? ? ? ? ? ? ? ?? ? ? ? ? ? ? ? ?? ? ? ? ? ? ? ? ? ? ? ? ? ? ? ? ? ?? ? ? ? ? ? ? ? ?? ? ? ? ? ? ? ? ? ? ? ? ? ? ? ? ? ?? ? ? ? ? ? ? ? ?? ? ? ? ? ? ? ? ? ? ? ? ? ? ? ? ? ?? ? ? ? ? ? ? ? ?? ? ? ? ? ?? ? ? ? ? ? ? ? ? ? ? ? ? ? ? ? ? ? ? ? ?? ? ? ? ? ?? ? ? ? ? ? ? ? ? ? ? ? ? ? ? ? ? ? ? ? ?? ? ? ? ? ? ? ? ? ? ? ? ? ? ? ? ? ? ? ? ? ? ? ? ? ? ? ? ? ? ? ? ? ? ? ? ? ? ? ? ?
Angel work GRID https://www.facebook.com/InfographicNews https://www.facebook.com/InfographicMOVE https://www.facebook.com/infographic.thailand https://www.facebook.com/pinfographics sample
INFORMATION SYSTEM INPUT PROCESS OUTPUT sample
คิดต่าง = ต่างคิด R E A D การประกันคุณภาพ การชวนเล่นเกม Steve Jobs บทเรียน Line บทเรียน Facebook sample
1 1 9 3 6 2 3 sample https://www.facebook.com/photo.php?fbid=173418336170144&set=a.167678680077443.1073741828.165512320294079
Feel Happiness sample https://www.facebook.com/photo.php?fbid=701550586541704&set=a.477834652246633.125010.477814995581932
http://education.kapook.com/view62570.html http://www.thaiall.com/blogacla/burin/3376/ sample
https://www.facebook.com/photo.php?fbid=10151762641208895&set=a.10150460359323895.382898.814248894https://www.facebook.com/photo.php?fbid=10151762641208895&set=a.10150460359323895.382898.814248894 ตัวอย่างไม่เน้นค่าสถิติ พฤติกรรมตามความรู้ มักถูกนำด้วยสิ่งที่ร่ำเรียนมา ปุถุชน ทั่วไป พุทธทาส พฤติกรรมตามความเชื่อ มักถูกนำด้วยรัก โลภ โกรธ หลง สมี.. กิเลสมาก่อน อย่างละครึ่ง ความรู้มาก่อน 851 * 315 sample https://www.facebook.com/photo.php?fbid=10152218867862272&set=a.423083752271.195205.350024507271
Process to share a book scanner a book image https://www.facebook.com/groups/thaiebook/ image Updated july 30,2013 sample https://www.facebook.com/photo.php?fbid=10152218867862272&set=a.423083752271.195205.350024507271
ตัวอย่างเน้นประเด็น Bar chart 1. ภาษาอังกฤษ 2. เทคโนโลยีสารสนเทศ 3. การคำนวณตัวเลข 4. ความคิดสร้างสรรค์ 5. ความเป็นผู้นำ 6. การสื่อสาร 7. การบริหารเวลา 8. การแก้ปัญหา 9. สังคม 10. การปรับตัว 11. การทำงานเป็นทีม 12. เทคนิค/เป็นมืออาชีพ sample http://www.thaiall.com/blog/burin/4063/
ตัวอย่างข้อมูลที่ 1ค่าสถิติจากผลสำรวจ ด้วย คำถามเดียว Data : - Work 39% - Join 37% - Go work then Join 6% - Others 18% sample https://www.facebook.com/photo.php?fbid=10151860413626937&set=a.147245756936.117721.147232991936
ตัวอย่างข้อมูลที่ 2 P A P E R C U P ใช้พลาสติก 7.2 แสนกิโลกรัม ใช้น้ำ 15000 แสนกิโลกรัม ใช้ต้นไม้ 6.5 ล้านตัน เพิ่มขยะ 115 ล้านกิโลกรัม เพิ่มคาร์บอนฯ 1800 ล้านกิโลกรัม sample https://www.facebook.com/photo.php?fbid=125047280999112&set=a.106711799499327.244.106331272870713
ตัวอย่างข้อมูลที่ 3เน้นสถิติตามปี Line Sticker = Emoticon sample http://thumbsup.in.th/2013/10/line-thailand-infographic/
ตัวอย่างข้อมูลที่ 4 เห็นภาพนี้แล้วนึกถึงศีล 5 ขึ้นมาเลย sample https://www.facebook.com/photo.php?fbid=602390536470922&set=a.451893141520663.103813.451864701523507
ตัวอย่างข้อมูลที่ 5ความสัมพันธ์ของ เกรด กับ หลายวิชา sample
ตัวอย่างข้อมูลที่ 6ค่าสถิติของภาค กับ จำนวนประชากร ... • เพศ • เมือง/ชนบท • อัตราชีพ • อายุ http://www.ipsr.mahidol.ac.th/ipsr-th/population_thai.html (มีอีกหลายรายการ) sample http://www.thailandometers.mahidol.ac.th/