Download
1 / 48
480 likes | 696 Views
The Use of High-Energy Protons in Cancer Therapy. Reinhard W. Schulte Loma Linda University Medical Center. A Man - A Vision. In 1946 Harvard physicist Robert Wilson (1914-2000) suggested * : Protons can be used clinically Accelerators are available

E N D
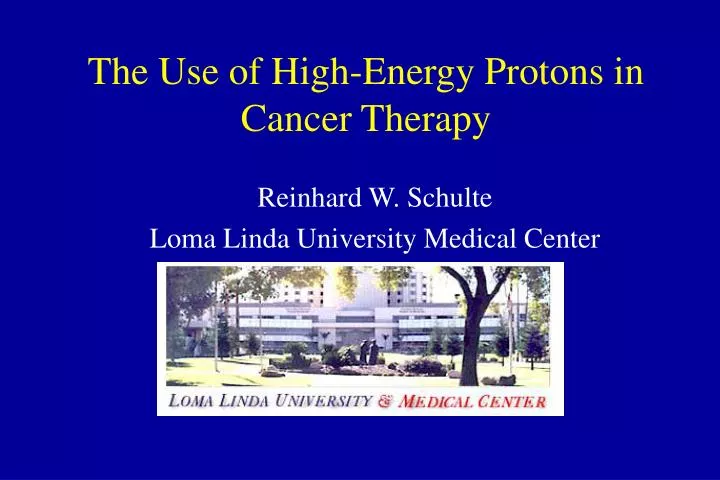
The Use of High-Energy Protons in Cancer Therapy Reinhard W. Schulte Loma Linda University Medical Center
A Man - A Vision • In 1946 Harvard physicist Robert Wilson (1914-2000) suggested*: • Protons can be used clinically • Accelerators are available • Maximum radiation dose can be placed into the tumor • Proton therapy provides sparing of normal tissues • Modulator wheels can spread narrow Bragg peak *Wilson, R.R. (1946), “Radiological use of fast protons,” Radiology 47, 487.
History of Proton Beam Therapy • 1946 R. Wilson suggests use of protons • 1954 First treatment of pituitary tumors • 1958 First use of protons as a neurosurgical tool • 1967 First large-field proton treatments in Sweden • 1974 Large-field fractionated proton treatments program begins at HCL, Cambridge, MA • 1990 First hospital-based proton treatment center opens at Loma Linda University Medical Center
World Wide Proton Treatments* Dubna (1967) 172 Moscow (1969) 3414 St. Petersburg (1969) 1029 Uppsala (1957): 309 PSI (1984): 3935 Clatterbridge(1989): 1033 Nice (1991): 1590 Orsay (1991): 1894 Berlin (1998): 166 HCL (1961) 6174 LLUMC (1990) 6174 Chiba (1979) 133 Tsukuba (1983) 700 Kashiwa (1998) 75 NAC (1993) 398 *from: Particles, Newsletter (Ed J. Sisterson), No. 28. July 2001
Gantry beam line Hospital-based facility Fixed beam line 40-250 MeV Synchrotron LLUMC Proton Treatment Center
p p (a) p’ q e p (b) p’ p nucleus (c) p’ e g, n p nucleus (d) Main Interactions of Protons • Electronic (a) • ionization • excitation • Nuclear (b-d) • Multiple Coulomb scattering (b), small q • Elastic nuclear collision (c), large q • Nonelastic nuclear interaction (d)
Modulated Proton Beam 10 MeV X-rays Relative Dose Unmodulated Proton Beam Depth in Tissue Why Protons are advantageous • Relatively low entrance dose • (plateau) • Maximum dose at depth • (Bragg peak) • Rapid distal dose fall-off • Energy modulation • (Spread-out Bragg peak) • RBE close to unity
Patient setup Patient movements Organ motion Body contour Target definition Relative biological effectiveness (RBE) Device tolerances Beam energy Uncertainties in Proton Therapy • Patient related: • Physics related: • CT number conversion • Dose calculation • Machine related: • Biology related:
Treatment Planning • Acquisition of imaging data (CT, MRI) • Conversion of CT values into stopping power • Delineation of regions of interest • Selection of proton beam directions • Design of each beam • Optimization of the plan
Treatment Delivery • Fabrication of apertures and boluses • Beam calibration • Alignment of patient using DRRs • Computer-controlled dose delivery
Computed Tomography (CT) • Faithful reconstruction of patient’s anatomy • Stacked 2D maps of linear X-ray attenuation • Electron density relative to water can be derived • Calibration curve relates CT numbers to relative proton stopping power X-ray tube Detector array
SP H Processing of Imaging Data SP = dE/dxtissue /dE/dxwater H = 1000 mtissue /mwater Relative proton stopping power (SP) CT Hounsfield values (H) Calibration curve Dose calculation Isodose distribution
CT Calibration Curve • Proton interaction Photon interaction • Bi- or tri- or multisegmental curves are in use • No unique SP values for soft tissue Hounsfield range • Tissue substitutes real tissues • Fat anomaly
CT Calibration Curve Stoichiometric Method* • Step 1: Parameterization of H • Choose tissue substitutes • Obtain best-fitting parameters A, B, C H = Nerel{A (ZPE)3.6 + B (Zcoh)1.9 + C} Rel. electron density Photo electric effect Coherent scattering Klein-Nishina cross section *Schneider U. (1996), “The calibraion of CT Hounsfield units for radiotherapy treatment planning,” Phys. Med. Biol. 47, 487.
CT Calibration Curve Stoichiometric Method • Step 2: Define Calibration Curve • select different standard tissues with known composition (e.g., ICRP) • calculate H using parametric equation for each tissue • calculate SP using Bethe Bloch equation • fit linear segments through data points Fat
1 mm 4 mm CT Range Uncertainties • Two types of uncertainties • inaccurate model parameters • beam hardening artifacts • Expected range errors Soft tissue Bone Total H2O range abs. error H2O range abs. Error abs. error (cm) (mm) (cm) (mm) (mm) Brain 10.3 1.1 1.8 0.3 1.4 Pelvis 15.5 1.7 9 1.6 3.3
MWPC 1 MWPC 2 p Energy detector SC Proton Transmission Radiography - PTR • First suggested by Wilson (1946) • Images contain residual energy/range information of individual protons • Resolution limited by multiple Coulomb scattering • Spatial resolution of 1mm possible
No of PTR pixels [%] SPcalc - Spmeas [%] Comparison of CT Calibration Methods • PTR used as a QA tool • Comparison of measured and CT-predicted integrated stopping power • Sheep head used as model • Stoichiometric calibration (A) better than tissue substitute calibrations (B & C)
Proton Beam Computed Tomography • Proton CT for diagnosis • first studied during the 1970s • dose advantage over x rays • not further developed after the advent of X-ray CT • Proton CT for treatment planning and delivery • renewed interest during the 1990s (2 Ph.D. theses) • preliminary results are promising • further R&D needed
Si MS 1 Si MS 2 Si MS 3 SC ED x p cone beam Trigger logic DAQ Proton Beam Computed Tomography • Conceptual design • single particle resolution • 3D track reconstruction • Si microstrip technology • cone beam geometry • rejection of scattered protons & neutrons
Aperture Inhomogeneity Modulator wheel Bolus Proton Beam Design
Proton Beam Shaping Devices Wax bolus Cerrobend aperture Modulating wheels
Ray-Tracing Dose Algorithm • One-dimensional dose calculation • Water-equivalent depth (WED) along single ray SP • Look-up table • Reasonably accurate for simple hetero-geneities • Simple and fast WED || P S
Protons No heterogeneity Bone Water W = 1 mm W = 1 mm Central axis dose W W = 2 mm W = 4 mm Central axis W = 10 mm 5 10 15 Depth [cm] Effect of Heterogeneities
Alderson Head Phantom Effect of Heterogeneities Range Uncertainties (measured with PTR) > 5 mm > 10 mm > 15 mm Schneider U. (1994), “Proton radiography as a tool for quality control in proton therapy,” Med Phys. 22, 353.
WED S P Pencil Beam Dose Algorithm • Cylindrical coordinates • Measured or calculated pencil kernel • Water-equivalent depth • Accounts for multiple Coloumb scattering • more time consuming
Monte Carlo Dose Algorithm • Considered as “gold standard” • Accounts for all relevant physical interactions • Follows secondary particles • Requires accurate cross section data bases • Includes source geometry • Very time consuming
Bone Water Ray-tracing Pencil beam Monte Carlo Comparison of Dose Algorithms Protons Petti P. (1991), “Differential-pencil-beam dose calculations for charged particles,” Med Phys. 19, 137.
Combination of Proton Beams • “Patch-field” design • Targets wrapping around critical structures • Each beam treats part of the target • Accurate knowledge of lateral and distal penumbra is critical Urie M. M. et al (1986), “Proton beam penumbra: effects of separation between patient and beam modifying devices,” Med Phys. 13, 734.
Lateral field Patch field 2 Patch field 1 Critical structure Combination of Proton Beams • Excellent sparing of critical structures • No perfect match between fields • Dose non-uniformity at field junction • “hot” and “cold” regions are possible • Clinical judgment required
100 A - no air gap B - 40 cm air gap 80 A B 60 % Dose 40 20 80%-20% 80%-20% 0 0 5 10 15 20 25 Distance [mm] Air gap Lateral Penumbra • Penumbra factors: • Upstream devices • scattering foils • range shifter • modulator wheel • bolus • Air gap • Patient scatter
10 Pencil beam 5 cm bolus 8 Ray tracing Measurement 6 20-80% penumbra 4 no bolus 2 0 0 4 8 12 16 Air gap [cm] Lateral Penumbra • Thickness of bolus , width of air gap lateral penumbra • Dose algorithms can be inaccurate in predicting penumbra Russel K. P. et al (2000), “Implementation of pencil kernel and depth penetration algorithms for treatment planning of proton beams,” Phys Med Biol 45, 9.
Nuclear Data for Treatment Planning (TP) Experiment Theory Evaluation † e.g., ICRU Report 63 ‡ e.g., Peregrine Integral tests, benchmarks Validation Quality Assurance Radiation Transport Codes for TP‡ Recommended Data†
Nuclear Data for Proton Therapy Application Quantities needed Loss of primary protons Total nonelastic cross sections Dose calculation, radiation Diff. and doublediff. cross sections transport for neutron, charged particles, and g emission Estimation of RBE average energies for light ejectiles product recoil spectra PET beam localization Activation cross sections
Selection of Elements Element Mainly present in ’ H, C, O Tissue, bolus N, P Tissue, bone Ca Bone, shielding materials Si Detectors, shielding materials Al, Fe, Cu, W, Pb Scatterers, apertures, shielding materials
Nuclear Data for Proton Therapy • Internet sites regarding nuclear data: • International Atomic Energy Agency (Vienna) • Online telnet access of Nuclear Data Information System • Brookhaven National Laboratory • Online telnet access of National Nuclear Data Center • Los Alamos National Laboratory • T2 Nuclear Information System. • OECD Nuclear Energy Agency • NUKE - Nuclear Information World Wide Web
All interactions Electronic interactions Nuclear interactions 250 MeV Energy Deposition (dE/dx) 0 5 10 15 20 25 30 35 40 Depth [cm] Nonelastic Nuclear Reactions • Remove primary protons • Contribute to absorbed dose: • 100 MeV, ~5% • 150 MeV, ~10% • 250 MeV, ~20% • Generate secondary particles • neutral (n, g) • charged (p, d, t, 3He, a, recoils)
p + 16O p + 14N p + 12C Nonelastic Nuclear Reactions Total Nonelastic Cross Sections Source: ICRU Report 63, 1999
Proton Beam Activation Products Activation Product Application / Significance Short-lived b+ emitters in-vivo dosimetry (e.g., 11C, 13N, 18F) beam localization 7Be none Medium mass products none (e.g., 22Na, 42K, 48V, 51Cr) Long-lived products in radiation protection collimators, shielding
Positron Emission Tomography (PET) of Proton Beams Reaction Half-life Threshold Energy (MeV) e 16O(p,pn)15O 2.0 min 16.6 16O(p,2p2n)13N 10.0 min 5.5 16O(p,3p3n)13C 20.3 min 14.3 14N(p,pn)13N 10.0 min 11.3 14N(p,2p2n)11C 20.3 min 3.1 12C(p,pn)17N 20.3 min 20.3
110 MeV p on Lucite, 24 min after irradiation Activity PET experiment calculated activity calculated energy deposition dE/dx 0 2 4 6 8 10 Depth [cm] PET Dosimetry and Localization • Experiment vs. simulation • activity plateau (experiment) • maximum activity (simulation) • cross sections may be inaccurate • activity fall-off 4-5 mm before Bragg peak Del Guerra A., et al. (1997) “PET Dosimetry in proton radiotherapy: a Monte Carlo Study,” Appl. Radiat. Isot. 10-12, 1617.
PET Localization for Functional Proton Radiosurgery • Treatment of Parkinson’s disease • Multiple narrow p beams of high energy (250 MeV) • Focused shoot-through technique • Very high local dose (> 100 Gy) • PET verification possible after test dose
Relative Biological Effectiveness (RBE) • Clinical RBE: 1 Gy proton dose 1.1 Gy Cobalt g dose (RBE = 1.1) • RBE vs. depth is not constant • RBE also depends on • dose • biological system (cell type) • clinical endpoint (early response, late effect)
40 MeV 100 MeV 250 MeV Depth Linear Energy Transfer (LET) vs. Depth
6.0 high 5.0 4.0 RBE 3.0 2.0 low 1.0 0.0 100 101 102 103 104 LET [keV/mm] RBE vs. LET Source: S.M. Seltzer, NISTIIR 5221
1.7 high 1.6 160 MeV 1.5 1.4 RBE 1.3 Clinical RBE 1.2 1.1 low 1.0 0.9 1.0 Modulated beam 0.8 0.6 Relative dose 0.4 0.2 0.0 0 2 4 6 8 10 12 14 16 18 20 Depth [cm] RBE of a Modulated Proton Beam Source: S.M. Seltzer, NISTIIR 5221
Open RBE Issues • Single RBE value of 1.1 may not be sufficient • Biologically effective dose vs. physical dose • Effect of proton nuclear interactions on RBE • Energy deposition at the nanometer level - clustering of DNA damage
Summary • Areas where (high-energy) physics may contribute to proton radiation therapy: • Development of proton computed tomography • Nuclear data evaluation and benchmarking • Radiation transport codes for treatment planning • In vivo localization and dosimetry of proton beams • Influence of nuclear events on RBE