Download
1 / 22
220 likes | 340 Views
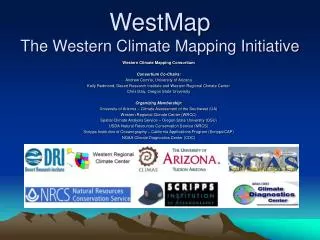
WestMap The Western Climate Mapping Initiative. Western Climate Mapping Consortium Consortium Co-Chairs: Andrew Comrie, University of Arizona Kelly Redmond, Desert Research Institute and Western Regional Climate Center Chris Daly, Oregon State University Organizing Membership:

E N D
WestMapThe Western Climate Mapping Initiative Western Climate Mapping Consortium Consortium Co-Chairs: Andrew Comrie, University of Arizona Kelly Redmond, Desert Research Institute and Western Regional Climate Center Chris Daly, Oregon State University Organizing Membership: University of Arizona – Climate Assessment of the Southwest (UA) Western Regional Climate Center (WRCC) Spatial Climate Analysis Service – Oregon State University (OSU) USDA Natural Resources Conservation Service (NRCS) Scripps Institution of Oceanography – California Applications Program (Scripps/CAP) NOAA Climate Diagnostics Center (CDC)
WestMap Aims • 50-100 years, 1 km gridded, monthly climate observations, continuously updated • Provide to data users & stakeholders: • online analysis tools • associated error/accuracy estimates • educational resources
Background • Very high stakeholder demand for these kinds of climate data • noted by the NOAA-funded Regional Integrated Science and Assessment (RISA) projects across the west (e.g., CLIMAS, the Climate Assessment for the Southwest) • Main WestMap focus on a western US domain • Large demand and complex climate mapping challenges in the West • fine scale topographic variations • extensive high elevation mountain ranges • deserts • coastal boundary regions • interior valleys • rain shadows • data availability • poor station distribution • May evolve to: • national/international • northern Mexico and western Canada • daily data, but not initially
Product Applications • Five key areas • drought mitigation/monitoring, e.g.: • complement and enhance developing drought management initiatives and monitoring programs • in turn, these activities will help future mapping through identifying gaps/problems in the present data sets • climate variability • water management • global change modeling/assessment • forecasts (initial conditions) and downscaling of forecasts (limits of predictability, model verification) • WestMap impact will be very wide • Very large number of likely users: researchers, decision-makers, resource mgrs, etc. • integral climate mapping web interface for ease of access
Data Development & Operations Data Access, Visualization & Educational Resources Error Assessments, Data Analyses & Diagnostics 3 Major WestMap Components better access and tools; increased dataset utility algorithm improvements and data updates improved online tools and understanding of data uncertainty
WestMap Data Development • PRISM (Parameter-Elevation Regressions on Independent Slopes Model) • developed by Spatial Climate Analysis Services / Oregon Climate Services at Oregon State University • uses point data, a digital elevation model (DEM), and other spatial datasets to generate gridded estimates of annual, monthly, and event based climatic parameters • a coordinated set of rules, decisions, and calculations designed to approximate the decision-making processes that an expert operational climatologist would make in creating a climate map • currently has the most advanced algorithms for fine-scale mapping of climate data • QA via quantitative measures and expert review • recently used to create a 4km scale gridded data set of monthly minimum temperature, maximum temperature, and precipitation for the conterminous United States covering the period of 1895-2001 • official updates of the Climate Atlas of the United States • USDA precipitation and temperature maps for all fifty states • WestMap intends to take PRISM data one step further to create a “surface data reanalysis” • analogous to the NCEP reanalysis projects and related interfaces • 1 km-scale monthly surface climate data • major part of the instrumental record (50 to 100 years, depending on data constraints) • provide error estimation and quality assessment of the resulting data surfaces • update the record with as close to “real time data” as possible • Create the best available form of fine-scale climate data for mapping and monitoring • in short, a fundamental climate data set with a multitude of uses • also enables generation of other derived quantities • will permit data to be aggregated into new user-defined polygons rather than climate divisions • spatially detailed time histories of climate data will enable a wide range of basic and applied research
Error & Accuracy Assessment • Error/accuracy assessment is important but difficult • e.g., data limitations at higher elevations require the use of any and all data points for those levels, but this simultaneously constrains the application of standard cross-validation techniques • maps with the lowest overall errors not necessarily the most accurate, when assessed with vegetation patterns, stream flow, expert review, and other independent methods • Will employ multiple quantitative measures and other expert and lay review approaches to understand and communicate error • Also important to understand and correct for sources of error • error is both time- and space-dependent • expect to encounter sources of modeling error manifesting themselves at seasonal, interannual and decadal scales • sources of error with spatial variability at local and regional scales • will likely parallel those in the observed climate data record • will need to tease apart those processes requiring representation in improved versions of the modeling algorithms
Data Analyses & Diagnostics • Investigations of patterns and process underlying variability and error in the WestMap data will also enable us to research a number of related complementary and critical questions • Examples: • fine-scale data response to large-scale atmospheric processes • critical gaps in data coverage • episode monitoring applications (e.g., drought) • sub-regional climate variability • possible climate forecast model implementations of WestMap • data consistency versus accuracy • data assimilation and mapping • expert/lay perceptions of climate information and delivery • educational needs
Data Access • Primary user interface via WRCC (website, online tools, data downloads) • Data cost approach similar to federally-managed climate datasets • online access at no cost to public sector government and educational users (“.gov” & “.edu”) • optional media (CD, tape, etc.) and large or special requests available at nominal cost • fee structure for other interested users (e.g., private sector) • Public-private collaboration • users of free data cannot release them to third-parties to circumvent the access restrictions • some PRISM data products are currently marketed through a licensing agreement between OSU and a private company, Climate Source, Inc. • this will remain the outlet for private sector data delivery • will provide increased financial support for the continued production of up to date climate maps for the public and private sector, adding to the database over time • valuable way to continue WestMap growth after tools have been developed and public funding enters a lower-level, operational phase • WestMap data storage • operationally stored at the Western Regional Climate Center • final archival storage at the National Climatic Data Center
Visualization Tools • Cannot overstate the crucial role of visualization for data analysis • Online visualization tools are a cornerstone of WestMap development • leading example: NOAA CDC’s online tools for the NCEP reanalysis data set • provides ability to manipulate, map, and associate data with other information (e.g., climate indices) in real time • greatly improves the accessibility of the data for analysis and download by all categories of users • core reason for the success and widespread use of the reanalysis data • Similarly, WRCC has developed a variety of online data plotting tools • WestMap will capitalize on these activities • development of specific new tools for spatial and temporal analysis • likely incorporation of WestMap data into above data analysis portal sites • Visualization tools will be developed from the outset • Selected 4 km PRISM data are already publicly available • will form the initial dataset for development of WestMap visualization tools while the 1 km data are being produced
Animation • Zoom • pixels, polygons • Time Plots • Multi-panel display
Education/Outreach Resources • WestMap-type data are intuitive and appealing to many users • especially because they are based on observational data • But, there are important caveats to be communicated • the data are nonetheless synthetic • appropriate use is contingent upon understanding how they were developed • Also a need to provide educational & outreach resources • for K-12, universities and broader stakeholders • WestMap includes development of interactive educational materials • explain critical metadata, including caveats and error estimation • information resources to enable meaningful data interpretation and applications
WestMap Consortium Membership Roles • Unique climate mapping needs & challenges of the West are the driving forces behind the genesis of WestMap • therefore, WestMap is an initiative undertaken “by the West and for the West” • Consortium of institutions with extensive expertise and experience in western U.S. climatological research • also climate mapping techniques, social science of climate & impacts, information transfer to technical users and stakeholders • University of Arizona (UA) • primary project coordination, in collaboration with other consortium members • stakeholder linkages, development of educational resources, aspects of data visualization, climate variability research, and social science aspects of WestMap • extensive experience working with climate information and stakeholders through its RISA project, CLIMAS • Western Regional Climate Center (WRCC) • will host the user interface, data access & visualization engine • will continue to be a primary supplier of observed climate data to the OSU PRISM system • will maintain the stored WestMap data products and coordinate final archiving via links to NCDC • Oregon State University (OSU) Spatial Climate Analysis Service • responsible for development, operation (production, quality control) and refinement of the 1 km PRISM data sets • continued supply of updated data grids via link to Climate Source, Inc. • Scripps Institution of Oceanography (Scripps) • will participate in data quality analyses and sub-regional scale climate variability research • using WestMap data to develop finer scale seasonal-annual climate forecasting efforts • broad experience and expertise in climate analyses and working with major resource decision-makers via CAP RISA • USDA Natural Resource Conservation Service (NRCS) • research partner through data evaluation and data application assessment • primary source of high elevation precipitation (SNOTEL) data for PRISM • stakeholder via drought monitoring, water management, and water-related forecasting responsibilities • long-time sponsor of PRISM product development. • NOAA Climate Diagnostics Center (CDC) • development of data assimilation and online analysis tools for the WestMap data sets • quantitative data quality assessment, links to data assimilation in climate forecast applications • expertise and experience in the development of online user interface-application tools for accessing gridded climate data
WestMap Funding Strategy • Build the WestMap idea, simultaneously obtain funding from a range of sources • wide range of stakeholders and potential users • many do not have the budgetary resources to completely support such an initiative • thus, define as an initiative that will attract partial, leveraged funding for several sub-projects • obtain broad “buy-in” from multiple agencies / institutions • will better engage the climate data user community in funding a common data source • investigating multiple sources of funding • federal agencies (e.g., NSF, NOAA, NASA, USDA, USGS) and multi-agency initiatives, Western Governor’s Association and/or Congressional funding, public-private enterprise programs, and others • given importance for western stakeholders, explore RISA resources • WestMap is a large effort that needs substantial financial support • set of postdocs, programmers, and grad students across several institutions • ideally, 3-5 years of funding on the order of $200-500K+ per year • will support the core development and initial operational components of the initiative • Explore public-private partnership to support continued data production • take advantage of lower level of reliable steady support • follows high-cost development phase • costs of storing/serving established data sets could be partly absorbed into regular operations • major future upgrades will still need conventional funding
WestMap Status • Held an organizational planning meeting • January 8-9, 2003, hosted by UA/CLIMAS • established WestMap Consortium • defined objectives of the WestMap initiative • Initial efforts now officially underway • consortium has begun looking for funding partners • Website coming soon • CDC lead on ESDIM proposal • PACLIM, Climate Diagnostics Workshop • Contacting agencies/program managers