Download
1 / 14
140 likes | 289 Views
Statistics Normal Probability Distributions. Chapter 6 Example Problems. Normal Probability Distributions. Mean = 0 Standard Deviation = 1. Normal Probability Distribution. Table in back of textbook Negative z scores Positive z scores. Normal Probability Distribution.

E N D
StatisticsNormal Probability Distributions Chapter 6 Example Problems
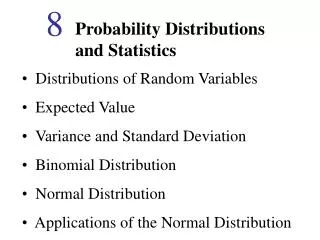
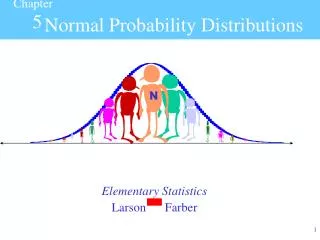
Normal Probability Distributions • Mean = 0 • Standard Deviation = 1
Normal Probability Distribution • Table in back of textbook • Negative z scores • Positive z scores
Normal Probability Distribution • Find the area of the shaded region • Look in table and find row 0.6 and column 0.06 as this is 0.66 z = 0.66
Normal Probability Distribution • Question: Assume the readings on thermometers are normally distributed with a mean of 0o C and a standard deviation of 1.00o C. • Find the probability that a randomly selected thermometer reads greater than 2.26 and draw a sketch of the region.
Normal Probability Distribution • Answer: We know that we are going to shade to the right of our given value of 2.26 because it said "greater than". So we need to find this z value z = (x - mean) / standard deviation z = (2.26-0)/1 = 2.26 • So we look up in our table the value of z = 2.26. I look in the Positive z Scores table and look in the row 2.2 and column .06 and find 0.9881. • But remember this is not the area to the right of 2.26, this would be the area to the left of 2.26. So I need to take 1 - 0.9881 (remember the entire area adds to 1) = 0.0119.
Calculator • If you want to use your calculator to find the z score instead of the table, • 2nd VARS • normalcdf(2.26, 10) • NOTE: The 10 is just giving a very large value because we cannot tell the calculator where to stop or to go to infinity.
Normal Probability Distributions • Question: Assume that women's heights are normally distributed (this is the key to use the normal z table) with a mean given by mean = 63.4 inches and a standard deviation = 1.8 inches. • If a woman is randomly selected, find the probability that her height is between 62.9 inches and 63.9 inches.
Normal Probability Distributions • Answer: Find the z value with the formula z = (x – mean) / standard deviation for the lower value of x = 62.9 and upper value x = 63.9 Low z = (62.9 – 63.4) / 1.8 = -0.28 (rounded to two decimals) Upper z = (63.9 – 63.4) / 1.8 = 0.28 (rounded to two decimal places) • So “between” would be the area between z = -0.28 and z = 0.28
Normal Probability Distributions • The area from the bottom of the normal curve up to z = -0.28 is found in the Negative z scores table. Look up -0.2 in the row and .08 in the column to get .3897. • The area from the bottom of the normal curve up to z = 0.28 is found in the Positive z scores table. Look up 0.2 in the row and .08 in the column to get .6103. • Since this is the area between, if you subtract these two values you get the area between • .6103 - .3897 = .2206