Download
1 / 18
180 likes | 410 Views
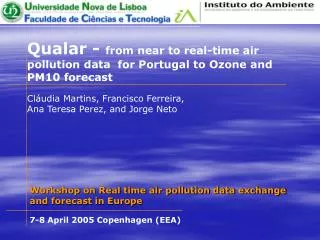
Qualar - from near to real-time air pollution data for Portugal to Ozone and PM10 forecast Cláudia Martins, Francisco Ferreira, Ana Teresa Perez, and Jorge Neto. Workshop on Real time air pollution data exchange and forecast in Europe. 7-8 April 2005 Copenhagen (EEA).

E N D
Qualar - from near to real-time air pollution data for Portugal to Ozone and PM10 forecast Cláudia Martins, Francisco Ferreira, Ana Teresa Perez, and Jorge Neto Workshop on Real time air pollution data exchange and forecast in Europe 7-8 April 2005 Copenhagen (EEA)
QUALAR information system Workshop on Real time air pollution data exchange and forecast in Europe 7-8 April 2005 Copenhagen
Process of data transmission CCDRs – Commission of Coordination and Regional Development Air Quality Monitoring Stations Environment Institute QUALAR On-line Data Base ATMIS Application – collecting the data from AQMS and sending to the data base server Validation during weekdays Workshop on Real time air pollution data exchange and forecast in Europe 7-8 April 2005 Copenhagen
Qualar - Stations Workshop on Real time air pollution data exchange and forecast in Europe 7-8 April 2005 Copenhagen
Qualar - Measurements Workshop on Real time air pollution data exchange and forecast in Europe 7-8 April 2005 Copenhagen
Qualar - Air Quality Index Very Good Good Medium Weak Bad The daily index for Portugal is calculated for each zone (an agglomeration is also a zone) and is based on the average for each pollutant between all equipments in the zone. The index is determined by the worst pollutant concentration measured in one or more monitoring stations Workshop on Real time air pollution data exchange and forecast in Europe 7-8 April 2005 Copenhagen
Qualar – Air Quality Index - Provisory Index available after 18h00, based on the results measured between 00h00 and 15h00; - Definitive Index From the previous day available at the same time. The existence of an index for a zone depends on the following conditions: 1. There must be at least one equipment for NO2, SO2, O3 e PM10 . Although it is used on the index calculation the existence of CO equipment is not mandatory; 2. The efficiency of the measurements must be equal or greater then 75% Workshop on Real time air pollution data exchange and forecast in Europe 7-8 April 2005 Copenhagen
Qualar – Exceedances Workshop on Real time air pollution data exchange and forecast in Europe 7-8 April 2005 Copenhagen
Air quality forecast for the area ofLisbon, Portugal Workshop on Real time air pollution data exchange and forecast in Europe 7-8 April 2005 Copenhagen
Methodology • Methodologies already used (Casmassi, 1987; EPA, 2003; and others) • Two years meteorological and air quality database (2001-2002) • Subjective analysis of surface and 500mb synoptic situations • Models construction: • Classification and Regression Tree (CART) analysis • multiple linear regression (MR) analysis • Testing and validating the obtained models Workshop on Real time air pollution data exchange and forecast in Europe 7-8 April 2005 Copenhagen
Data used • - Air quality data from the several stations of the case study area (O3, PM10, CO, NO2 and SO2) • - Surface meteorological data – Maximum temperature and average relative humidity from various cities, and pressure difference between Lisbon and other cities • - Altitude meteorological data for Lisbon - geopotencial height, temperature and relative humidity at 1200UTC for several levels • - Subjective analysis of synoptic situations (surface and 500 mb) at 1200UTC • - Day of week, flag “type of day”, and solar duration day Workshop on Real time air pollution data exchange and forecast in Europe 7-8 April 2005 Copenhagen
Synoptic situations Frontal systems 1– Frontal systems Low pressure systems 2 – Deepening low pressure (instability) 3 – low pressure influence High pressure systems 4 – surface calm 5 – N/NW circulation 6 – High pressure and thermal through from the north of Africa 7 – NE/E circulation Surface 1– Cut off low 2 – Low pressure trough 3 – Approaching trough or ridge breakdown 4 – Building high pressure ridge or zonal flow 5 – High pressure ridge 500mb Workshop on Real time air pollution data exchange and forecast in Europe 7-8 April 2005 Copenhagen
CART analysis Workshop on Real time air pollution data exchange and forecast in Europe 7-8 April 2005 Copenhagen
Multiple regression models Workshop on Real time air pollution data exchange and forecast in Europe 7-8 April 2005 Copenhagen
Modeling Test Summer 2003 Workshop on Real time air pollution data exchange and forecast in Europe 7-8 April 2005 Copenhagen
Results • The model results achieved are very satisfactory (the correlation is always higher than 0.973) • The model application results in other periods (year 2003) shows inferior correlations but still highly significant; • A does not exist for PM10; therefore the final results strong relation between O3 and some meteorological parameters exists (temperature). Such a strong relationship with a variable are worse; • Air quality index is also well predicted, since the two pollutants always determine the final result.
Workshop on Real time air pollution data exchange and forecast in Europe 7-8 April 2005 Copenhagen
Availability • The model uses measurementsfrom air quality and meteorology taken in the last 24 hours between 1500 GMT (the day before) and 1500 GMT (actual day); • Predicted values for next day come out validated at 1700 GMT; • Model application results to an out-of-trend year (2003) shows inferior correlations but still highly significant; • Application is being extended first to Greater Porto Metropolitan Area agglomerations, and then to the all country; • At the same time, a forecast physico-chemical mathematical model is being developed for the all country (in articulation with Universidade de Aveiro), and the integration of results from both is foreseen.