
Uploaded by
nhu
2 SLIDES
157 VIEWS
20LIKES
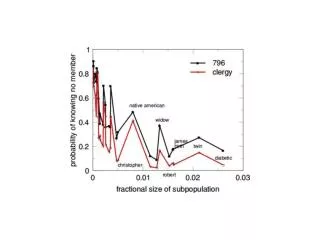
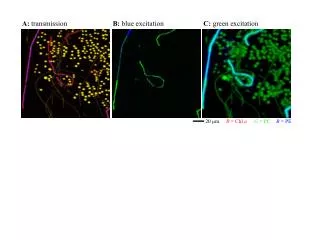
Exploring Graphs in Transmission Bias Theory
DESCRIPTION
This article delves into the role of graphs in understanding transmission bias within various fields, including epidemiology and genetics. It highlights how visual representations can illuminate pathways of influence, biases in data, and the mechanisms that drive transmission phenomena. By analyzing complex relationships through graph theory, we can gain insights into the dynamics of information spread, disease transmission, and genetic variations. The integration of graphs into transmission bias theory offers a robust framework for predicting outcomes and developing intervention strategies.
Download
1 / 2
Download Presentation 
Exploring Graphs in Transmission Bias Theory
An Image/Link below is provided (as is) to download presentation
Download Policy: Content on the Website is provided to you AS IS for your information and personal use and may not be sold / licensed / shared on other websites without getting consent from its author.
Content is provided to you AS IS for your information and personal use only.
Download presentation by click this link.
While downloading, if for some reason you are not able to download a presentation, the publisher may have deleted the file from their server.
During download, if you can't get a presentation, the file might be deleted by the publisher.
E N D
Presentation Transcript


More Related