Download
1 / 24
240 likes | 368 Views
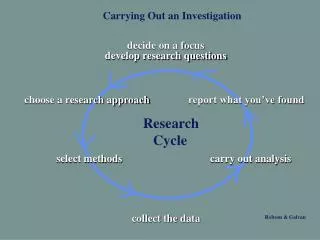
To carry out an investigation of plant species in a local habitat using quantitative survey. 1. Introduction. Background research outlined and referenced. I started to research my project by investigating what is meant by a quantitative survey in my local habitat.

E N D
To carry out an investigation of plant species in a local habitat using quantitative survey.
1. Introduction
Background research outlined and referenced. • I started to research my project by investigating what is meant by a quantitative survey in my local habitat. • I researched the topic in my science book ‘Breakthrough Science’, ‘Exploring Science’ and a book on flowers called ‘Easy Wildflower Guide’ by Neil Fletcher in order to identify some plants before I went out on the investigation.
Background research outlined and referenced. • I found the definition for a quantitative survey in a leaving certificate biology book: ‘Provides information on the numbers of each type of plant species in the habitat’. • I researched what types of equipment I could use in my investigation, that of a quadrat of dimensions 1m x 1m which is 1m squared in area.
Investigation is stated as a problem statement. • During the investigation I intend to answer the following question • ‘How does a quadrat show the variety of species in a local habitat’.
2. Preparation and Planning
Identification of variables. • Independent variable: This variable involves the location of the quadrat and random sampling in the area. • Dependent variable: The climate and the amount of plant species inside the quadrat area. • Fixed variables: Types of plants under investigation and the type of quadrat; that of a 1m squared.
A fair test where appropriate is outlined. • To ensure a fair test, we ensure that the fixed variables remained the same. • The type of quadrat • The area to be tested on our school grounds alongside the gym. • Throwing at random. • Repeating ten times.
Resource List Complete • A 1m x 1m quadrat • A pencil • A ground thermometer • Biology books and an ecology keys
Plan adequate to test the problem statement • I plan to test my problem statement using the quadrat and by throwing it at random. • I need to ensure to throw the quadrat numerous times in order to achieve a fair test result.
3. Procedure and Diagrams
Equipment and safety issues outlined. • A quadrat, a pencil,paper. • Safety issues would include wearing correct outdoor clothing suitable for the current days weather. • Care should be taken to ensure that that the grids in the quadrat are secure and that no girls are in the vicinity whilst throwing.
Procedures listed in clear steps and in a logical order • Gather all pieces of apparatus ie the quadrat, pencil, flowering book and science copy. • Mark out or measure the habitat area. • Throw the quadrat randomly over your shoulder ten times in different parts of the habitat. .
Procedures listed in clear steps and in a logical order • I selected ten hits on every quadrat that I threw and placed a pen at this point. • If it touches the organism it is recorded on my table as a ‘hit’. • I completed the table showing a list of the plants identified using my flower book. • I decided to list 5 plants in total using my quadrat, I recorded my results in my table and applied the DAFOR scale to my results.
Accurate Calculations • The DAFOR scale shows and expression of the number of plants in a habitat. • The letters stand for: • D = dominant • A = abundant • F = frequent • O = occasional • R = rare.
4. Calculations and data analysis
Accurate Calculations. D = Blue A= Orange F= Green O = Yellow R = Red
Relationship tested over full range. • A large number of plants in total were investigated in the quantitative analysis over a large grassland area. • The number of plants that could potentially be investigated were infinite. • From the resulting bar chart it is clear that a large range of plants were investigated and their frequency clearly shown as per the DAFOR scale.
5. Comments.
Relationship between variables discussed. • I accurately investigated the relationship between the variety of species found in the grassland area and through the use of the quadrat. • Different quadrats had different species of plant hence the need for random sampling and repetition. • The quadrat allowed me to successfully locate a large number of plants in my chosen area of grassland.
Factors affecting results. • A large variety of plant species grew in areas of consistent sunlight during the day as compared to an area shaded by trees as shown by the centre of our results on the bar chart. • Plants require natural sunlight in order to grow properly while temperature and weather conditions also had an effect on plant growth and variety.
…Refinements • The analysis and information collected by table and graph showed that less plants grew in a shaded area compared to in an area of sunshine. • Refinements such as selecting an area outside the confines of the school with a greater variety of species or selecting a different time of year could also be factored into our analysis.