Download
1 / 13
130 likes | 256 Views
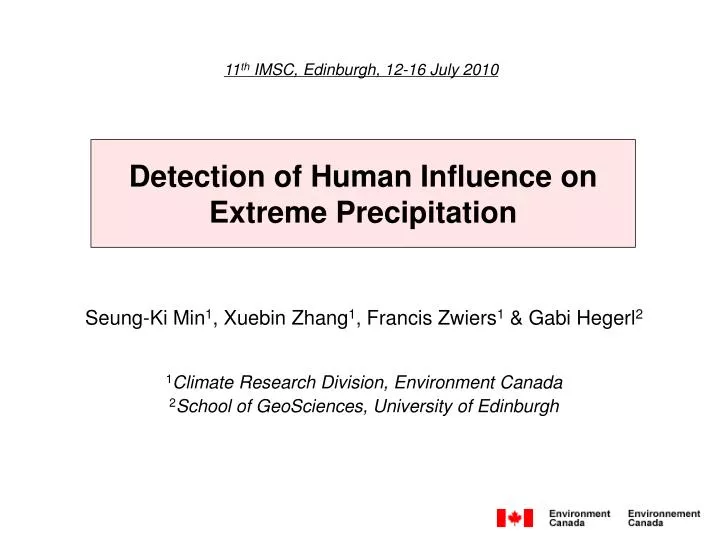
11 th IMSC, Edinburgh, 12-16 July 2010. Detection of Human Influence on Extreme Precipitation. Seung-Ki Min 1 , Xuebin Zhang 1 , Francis Zwiers 1 & Gabi Hegerl 2 1 Climate Research Division, Environment Canada 2 School of GeoSciences, University of Edinburgh. Extreme Precipitation Changes.

E N D
11th IMSC, Edinburgh, 12-16 July 2010 Detection of Human Influence on Extreme Precipitation Seung-Ki Min1, Xuebin Zhang1, Francis Zwiers1 & Gabi Hegerl2 1Climate Research Division, Environment Canada 2School of GeoSciences, University of Edinburgh
Extreme Precipitation Changes • Expected to increase globally as the climate warms • Clausius-Clapeyron relationship (e.g., Allen and Ingram 2002, Held and Soden 2006) • larger changes than those in mean precipitation • Coupled model simulations project an increase of extreme precipitation over large parts of the globe (IPCC TAR, AR4) • Observed changes are qualitatively consistent with model projections (Groismann et al. 2005; Alexander et al. 2006; Hegerl et al. 2007) • Challenges to formal detection and attribution • Spatially and temporally limited observations • Large inter-model disagreements especially in the tropics (Kharin et al. 2005, 2007) • Scaling issue: “point” observations vs. “area mean” model estimates (Osborn and Hulme 1997, Chen and Knutson 2008)
Detectability Studies • Perfect/Imperfect model studies • Hegerl et al. (2004, J. Climate) • CGCM2 and HadCM3 (2xCO2 - 1xCO2) • “A signal-to-noise analysis suggests that changes in extreme precipitation should become more robustly detectable than changes in mean precipitation” • Min et al. (2009, Climate Dyn.) • ECHO-G 20th century runs • Probability-based index to improve representativeness of area means of precipitation extremes and inter-comparison between observations and models • “Anthropogenic signals are robustly detectable over global/hemispheric domains, … largely insensitive to the availability of the observed data (based on HadEX) and to fingerprints from another model (CGCM3)”
This Study • Attempts to conduct formal detection analysis for extreme precipitations for 1950-99 • Real observations (HadEX) • Multi-model simulations (8 CMIP3 models) • Optimal detection technique • Probability-distribution based indices • Annual maximum daily (RX1D) and 5-day (RX5D) precipitations
Data • HadEX observations • Hadley Center global land-based climate extremes dataset (Alexander et al. 2006, JGR) • Based on 6000 stations and covers 1951-2003 • CMIP3 models - 20C3M for 1950-1999 • ANT (anthropogenic, 6 models, 19 runs) • ALL (natural plus anthropogenic, 5 models, 16 runs) • CTL (preindustrial control, 8 models, 106 x 50-yr chunks) • Preprocessing • Calculate extreme index on the original grid points • Interpolate them onto the same 5° × 5° grids • Consider grid points with more than 40-yrs observations during 1951-99
Probability Index (PI) • Convert 50-yr series of annual precipitation extremes into probability-based index (PI) ranging from 0-1 at grid-point base (1) Generalized extreme value (GEV) fit (2) Obtain PI time series Pa - annual extreme of precipitation in year a. - location, scale, and shape parameters (fixed with time)
PI Trends 1950-99 RX1D RX5D OBS ANT ALL • OBS: Overall increasing (some local decreasing over mid-lat Eurasia in RX5D) • ANT: increasing almost everywhere and reduced amplitude • ALL: similarly increasing in RX1D but noisier in RX5D
PI Time Series 1950-99 NH mean 5-yr mean (centered) RX1D RX5D ANT ALL • OBS (black) - increasing trends, ANT/ALL - increasing but reduced amplitude • Stronger trends in RX1D than in RX5D (consistent with CC relationship) • Notable inconsistency between OBS and ALL in early 1950s
Detection Analysis • Analysis variables • Area-averaged 5-year mean extreme indices (PIs for RX1D or RX5D) for 1950-99 (NH, Nmid, Ntro 10 dimensions) • Space-time approach (Nmid + Ntro 20 dimensions) • Optimal regression (Allen and Stott, 2003) • Observations (y) are regressed onto model simulated “fingerprints” (x): y = βx + ε • Total least square methods • Detection: 5-95% range of β (scaling factor) > 0 • Fingerprints (x) estimated from multi-model mean (ANT or ALL) • Internal variability (ε) estimated from CTL runs • Dimension reduced to 6 leading EOFs • based on a residual consistency test (Allen and Tett, 1999)
Detection Results for PI 1950-99 RX1D RX5D • ANTdetectable for both RX1D and RX5D • ANT signal robust for RX1D (detected when doubling internal variability, dashed) • ALLdetectable only for RX1D and less robustly • ANT scaling factors near 2-3 model response to ANT underestimated
Sensitivity Tests • 1955-1999 analysis • Excluding possible influence of ocean decadal mode (drying over North America in early 1950s) • ENSO residual observations • Excluding possible influence of ENSO, e.g. 1998 peak • Model samplings • 3 models that provide both ANT and ALL runs • Interpolation methods • Interpolating model datasets onto original HadEX grids (3.75º x 2.5º) Overall results are insensitive (not shown)
Conclusions • Formal detection analysis for precipitation extremes using HadEX observations and IPCC AR4 multi-model ensembles • Standardized probability index for better comparisons • Human influence detectable significantly, providing an evidence for human contribution to the observed intensification of heavy precipitation events during the latter half of the 20th century • Models tend to underestimate the observed change, suggesting possible underestimation of future projections Many caveats remain - observational uncertainty, model performance and structural uncertainty, and scaling issues