Download
1 / 33
330 likes | 364 Views
Explore the history of population theory by Malthus, demographic transition stages, current global trends, and future projections as per UN estimates. Understand the environmental impact of population growth and consumption.

E N D
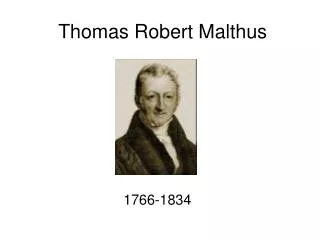
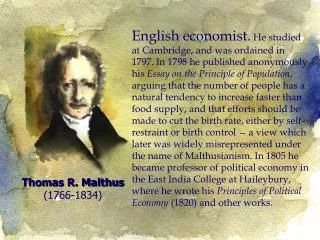
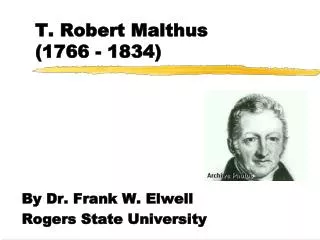
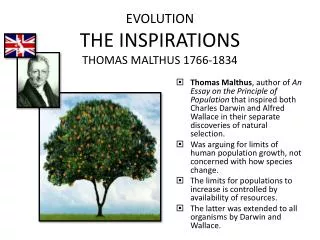
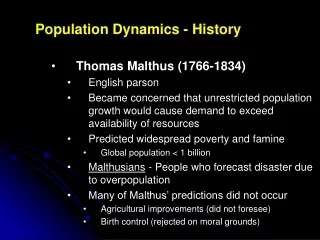
Population Dynamics - History • Thomas Malthus (1766-1834) • English parson • Became concerned that unrestricted population growth would cause demand to exceed availability of resources • Predicted widespread poverty and famine • Global population < 1 billion • Malthusians - People who forecast disaster due to overpopulation • Many of Malthus’ predictions did not occur • Agricultural improvements (did not foresee) • Birth control (rejected on moral grounds)
Demographic Transition • Theory developed to explain human population dynamics in response to economic development • Cohen – Four Stages • High birth & death rates (nearly equal but variable) Growth rate low • Death rate falls, becomes less variable; birth rate still high Growth rate rises, population increases. Mortality transition • Birth rate drops, death rate remains low or declines, growth rate slows, population increases. Fertility transition • Low birth & death rates (nearly equal, not variable), growth rate low or negative, population larger than before (1) • This process has occurred in many developed nations • United States, Canada, Japan, Western Europe
Demographic Transition • In recent years death rates in many developing nations have decreased • Status of social and economic changes that will supposedly lead to stable populations is unclear • Some neo-Malthusians pessimistic that fertility transition will occur • Garrett Hardin - “Lifeboat Ethics”
Population Dynamics - Trends • Demographics • Global population reached 6 billion in Oct 1999 and 7 billion in Oct 2011 • Most population growth currently taking place in developing nations • Developing nations contain 80% of global population • Percentage of global population growth in developing nations • 1950 – 85% • Today – 99%
Population Dynamics - Trends • Total Fertility Rate (TFR) • TFR = Fecundity • 2.0 = Replacement level fertility • Global TFR • 1950 – 5.0 • 2010 – 2.49 (50% decrease) • Africa – 4.27 (Niger – 6.86, Somalia – 6.17) • Asia – 2.26 (India – 2.52, China – 1.79) • N America – 1.98 (Canada – 1.62, Mexico – 2.04, USA – 2.02) • Europe – 1.53 (Bosnia – 1.24, Belarus – 1.29, Poland – 1.29) • PRB Map Source: UN Population Division
UN Population Division Roberts 2011
Population Dynamics - Trends • Population Projections - UN • Low Variant (TFR: 2.20 1.55 by 2100) • 2050 – 8.1 billion, 2100 – 6.2 billion • Medium Variant (TFR: 2.45 2.03) • 2050 – 9.3 billion, 2100 – 10.1 billion • High Variant (TFR: 2.70 2.51) • 2050 – 10.6 billion, 2100 – 15.8 billion • Constant Variant (TFR = 2.60 4.44) • 2050 – 10.9 billion, 2100 – 26.8 billion
Population Dynamics - Trends • Population Projections – UN • All scenarios include shifts in geographic distribution of population • Medium variant • Africa – 22.0% of population in 2050 (15.0% today) • Asia – 57.5% in 2050 vs. 60.6% today • Europe – 7.6% in 2050 vs. 10.7% today • N. America – 4.9% in 2050 vs. 5.1% today • Latin America – 8.0% in 2050 vs. 8.6% today • Shifts in age structure
Population – Environmental Effects • I = PAT (Ehrlich and Holdren, 1971) • I = Environmental Impact of nation • P = Population • A = Affluence (reflects consumption) • T = Technology (reflected in pollution) • Ex – Changes in CFC emissions related to technology, not population • Developments in technology historically not directed toward environmental preservation • “Ecological Footprint” • Area per capita to provide resources utilized • Compare to area available per capita in nation
I = PAT A number of people claim that “A” in “I = PAT” is more important than “P” or “T.” We typically talk about affluence in terms of consumption. Many people (including all the people in this class) claim that they “overconsume.” Can we quantify overconsumption? Can we give an ethical account of overconsumption?
Ecological Footprints:Definition and Comparative Statistics The ecological footprint of a specified population is: the area of ecologically productive land and water in various classes (cropland, pasture, forests, etc.) that would be required on a continuous basis: 1. to provide all the energy/material resources consumed, and 2. to absorb all the wastes discharged by that population with prevailing technology, wherever on Earth that land (and water) is located. According to one estimate from the Global Footprint Network, the average person on Earth in 2007 used 2.7 global hectares per capita. Lowest: Afghanistan = 0.6 ha. and Bangladesh = 0.6 ha. Highest: United Arab Emirates = 10.7 ha and Qatar = 10.5 ha. United States = 8.0 ha. http://www.footprintnetwork.org/gfn_sub.php?content=national_footprints
“The Power is Yours!” “Consumers should adjust their activities out of concerns for the Earth!”
Commercial Break “The Power is yours to be happy!” “She or he who dies with the most toys wins!”
Two Concepts of Consumption Buying, using, and discarding of specific commodities or goods. Depleting the Earth’s resources and exhausting its capacity to safely absorb effluents and emissions.
Consumption in the Developed World We increasingly think of ourselves as consumers rather than citizens. Much of what is produced is not necessary for biological survival and caters to consumers’ discretionary subjective preferences and wants, often shaped by targeted marketing. Economic well-being increasingly is tied to a quest for subjective experiences (e.g., music versus a CD), but such experiences still require material flows. Economic well-being also increasingly is service-oriented, in that people seek labor-intensive activities (e.g., going out to dinner for a the experience of having an aesthetically attractive meal), but such activities still require material flows.
Consumption in the Developing World Many people aspire to live the consumptive lifestyle of the developed world. However, one central concern tends to be poverty and meeting basic needs. Today: 2.5 billion people live in poverty (households whose consumption expenditure per person per year has less purchasing power than $785.76 had in the United States in 1993) Flushing out poverty: 830 million people are chronically undernourished 1.1 billion people lack access to safe water 2.6 billion people lack access to basic sanitation 1 billion people lack adequate shelter 2 billion people lack access to needed medicine 774 million people are illiterate 18 million people die prematurely from poverty-related causes each year (50 thousand a day, 27 thousand of whom are children)
I = PAT While we can quantify people and population growth rates, and while we can attempt to quantify affluence or consumption in terms such as the ecological footprint, it might be difficult to think of how we might quantify technology. Technology results in two kind of things: (1) artifacts used for production and consumption, and (2) unwanted by-products: pollution and waste. There is an entire field of philosophy called philosophy of technology that examines what technology is and how we are related to it.
Thinking about Technology:Some Contemporary Ideas • Technological determinism: As technology develops and changes, the institutions of society change. • Autonomous technology: Technology increasingly works in an autonomous fashion, independent of humans. • Autonomous technological determinism: More and more, technology operates autonomously and reduces human life to the narrow demands of efficiency, • Human nature and technology: • Philosophers who tend to see technology in positive terms as primarily beneficial tend to define human nature in physical terms of tool-making. Our hands define who we are. • Philosophers who tend to see technology in negative terms as a danger or a curse tend to define human nature in mental terms of language-using and meaning-making. Our minds define who we are.
The Technological Vision Progress might be defined as acquiring: 1. the most numerous, 2. the widest variety, 3. and the very latest or most refined commodities that are: a. easier to use, b. more instantaneous, c. more pervasive, d. safer, e. and more aesthetically pleasing than what you currently own.
Some Ethical Concerns about Technology Technology tends to outrun ethics, as we invent more and more novel forms of technology and only afterward begin to think about the ethics of creating or using the technology. It can be difficult to locate ethical responsibility within modern (or postmodern) technosocial systems. Technological progress, consumption patterns, and thinking of ourselves in a fundamental sense as [techno]consumers tends to become so important that it can subvert ethics, politics, religion, and our own personal conceptions of the good life.
Ulrich Beck (1992): We live in a risk society To be modern is to live in a modern nation-state. A modern nation-state is a risk society. This is marked by an exponential increase in the production and use of hazardous chemical substances that permeate social institutions, human bodies, and the natural world. The new hazards of the risk society: 1. Are unlimited in time and space. 2. Potentially put everyone at risk. 3. May be minimized but not eliminated. 4. Are irreversible. 5. Have diverse sources that make tracking responsibility impossible. 6. Are incalculable in ways that exceed the capacities of organizations to provide insurance against them or compensation. 7. May be identified and measured only by scientific means.
Human Populations: The Classic Debate Thomas Malthus (1766-1834) English parson who advocated moral restraint as a check on population growth for working and poor classes because population unchecked increases geometrically while food supplies only grow at arithmetic rates. Malthusians or NeoMalthusians such as Paul Ehrlich. Marquis de Condorcet (1743-1794) French political economist who advocated a liberal economy, equal rights for all, and the advancement of scientific knowledge to continuously improve the human condition. Optimists or Technological Optimists such as Julian Simon.
Julian Simon Let’s not be so pessimistic. The supply of natural resources is infinite. Why? “Finite” is a mathematical and not an empirical concept. “Finite” has no precise, unambiguous meaning. Natural resources = services and not amounts of things. We cannot determine all the natural resources that exist. We become more efficient and adept at discovering new resources and exploiting old ones.
Resource Availability – “The Bet” • Resource Costs • In 1980, Julian Simon issued a “public offer to stake US$10,000 ... on my belief that the cost of non-government-controlled raw materials (including grain and oil) will not rise in the long run.” • Paul Ehrlich and two colleagues accepted challenge • “The Bet” • Ehrlich and colleagues selected five metals (chromium, copper, nickel, tin, tungsten) they felt would undergo large price increases. • They purchased (on paper) $200 worth of each on Sep 29 1980. • They designated Sep 29 1990 as the date to evaluate the bet. • If the inflation-adjusted prices of these metals rose, Simon would pay Ehrlich $10,000. If the prices fell, Ehrlich would pay Simon the loss in value. • During this 10-year period, the world’s population grew by over 800 million people. • The price of each of the five metals dropped, in some cases substantially (e.g. tin fell from $8.72/pound to $3.88/pound). • Ehrlich lost the bet, to the tune of $576.07.
I = PAT: Population, Affluence/Consumption, and Technology Is I = PAT a good way to think about human environmental impact? Why or why not? What is the proper place/role for technology, or what forms of technology are appropriate? How much do we need to consume, and to what end do we consume? Is the Earth overpopulated? Why or why not?