NEG
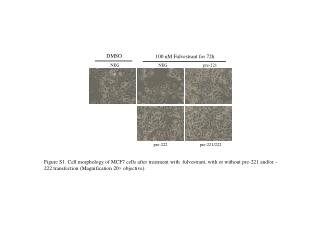
DMSO. 100 nM Fulvestrant for 72h. NEG. pre-221. NEG. Figure S1. Cell morphology of MCF7 cells after treatment with fulvestrant, with or without pre-221 and/or -222 transfection (Magnification 20× objective). pre-222. pre-221/222. ERα. p27. GAPDH.

NEG
E N D
Presentation Transcript
DMSO 100 nM Fulvestrant for 72h NEG pre-221 NEG Figure S1. Cell morphology of MCF7 cells after treatment with fulvestrant, with or without pre-221 and/or -222 transfection (Magnification 20× objective). pre-222 pre-221/222
ERα p27 GAPDH Figure S2. p27Kip1 and ERα protein level in MCF7 cells. 24 hours after transfection with pre-miR-221 (pre-221) and/or pre-miR-222 (pre-222), cells were treated with 10 nM fulvestrant for 2 days and subjected to immunoblotting analysis.
MCF7-F MCF7 MCF7-F NEG si-221/222 p27 GAPDH Figure S3. p27Kip1 protein level in MCF7, MCF7-F cells, and MCF7-F cells transfected with negative control (NEG) or antagomirs (si-221/222) for 72 hours.
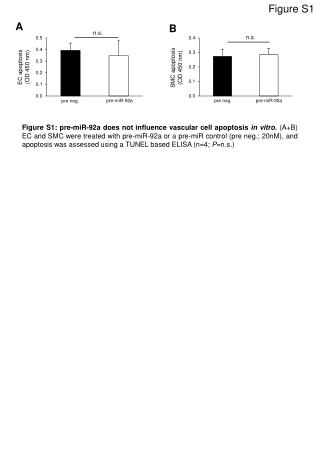
** ** ** Figure S4. Expression level of miR-221/222 in fulvestrant-resistant MCF7-F cells after knockdown of miR-221 (left panel) or miR-222 (right panel) using 2’-O-Me-antagomirs. (mean±SE, n=3). **P < 0.01.
** Figure S5. Clonogenic activity of MCF7 and fulvestrant-resistant MCF7-F cells. (mean±SE, n=3). **P < 0.01.
** ** NEG si-221 si-222 p27 GAPDH Figure S6. p27Kip1 mRNA (left) and protein level (right l) in MCF7-F cells transfected with si-221 or si-222 for 72 hours. (mean±SE, n=2, two independent experiments). **P < 0.01.
Upregulated by si-221 (919) A Upregulated by si-222 (601) Downregulated by si-222 (685) Downregulated by si-221 (688) B 428 224 Figure S7. Venn diagrams showing the number of probes regulated by miR-221 and miR-222 in fulvestrant-resistant MCF7-F cells. A. Probes upregulated by si-221 or si-222; B. Probes downregulated by si-221 or si-222.
** ** ** ** ** ** ** ** ** Figure S8. Fold-change of pathway activities in fulvestrant-resistant MCF7-F cells compared to MCF7 cells. Cignal Finder™ Cancer Pathway Reporter assay (SABiosciences Corporation, Frederick, MD) was performed according to the manufacturer’s instruction. (mean±SE, n=4). **P < 0.01.
Figure S9. qPCR results showing the time-course gene expression after transfection of MCF7 cells with miR-221/222 (solid lines), compared with scramble (dotted lines).
si-221/222 Scramble si-222 si-221 β-catenin Figure S10. Immunoblotting result of β-catenin in MCF7-F cells after antagomiR treatment. GAPDH MCF7-F
A B Figure S11. Cell proliferation assay of MCF7 cells. A. Cells were cultured in normal growth medium for 4 days. B. Cells were cultured in estrogen-free medium for 7 days. . (mean±SE, n=6). **P < 0.01. **
Figure S12. Dose dependent growth inhibition of MCF7 (black bars) and MCF7-F cells (gray bars) by TGF-β1 treatment. Cell numbers were determined using MTT assay and normalized to vehicle-treated cells.
MCF7 pre-221/222 pre-222 pre-221 pre-scramble NT ERα PTEN p27 MCF7-F GAPDH si-221/222 si-222 si-221 NEG NT PTEN p27 GAPDH Figure S13. Immunoblotting results of PTEN protein level in MCF7 and fulvestrant-resistant MCF7-F (PTEN antibody obtained from Cell Signaling Technology, Inc., Danvers, MA)