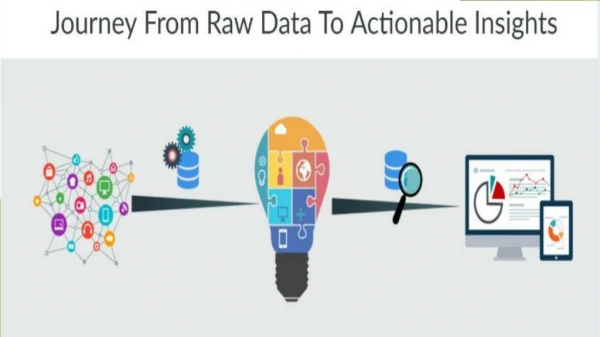
Data Driven Insights: Turning Raw Data into Actionable Decisions
Explore how data analysis is like cookingu2014choosing the right ingredients, cleaning, seasoning, and presenting insights for informed decision-making.


Data Driven Insights: Turning Raw Data into Actionable Decisions
E N D
Presentation Transcript
Data-Driven Insights: A Proven Recipe Welcome to Chef Data’s Kitchen! 🍽️ • Welcome to our culinary-inspired data journey, where we cook up insights instead of meals! Today, we’ll prepare a “Delicious Data Analysis Platter,” filled with rich flavors of insights, a dash of statistics, and a garnish of visualizations. So, let’s get cooking! 👨🍳👩🍳
Data-Driven Insights: A Proven Recipe Step 1: Choose Your Dish (Define the Problem) 🍛 • Before you start cooking: First and foremost, you need to decide what you’re making. Are you cooking pasta, baking a cake, or grilling a steak? • Data Version: Similarly, before diving into analysis, it’s important to define your goal. Are you trying to predict sales, understand customer churn, or detect fraud? Having a clear goal helps in picking the right ingredients (data). Otherwise, you might end up making a soup when you actually wanted a pizza. 🍕😆 Step 2: Gather Your Ingredients (Collect the Data) 🛒 • Now, let’s get our ingredients! Once you know what you’re making, it’s time to gather fresh veggies, the right spices, and the main ingredient for the dish. • Data Version: Likewise, collect data from different sources—databases, APIs, or spreadsheets. Make sure it’s fresh and relevant, just like ingredients in cooking. Using old or irrelevant data is like cooking with expired milk—nobody wants that! 🤢
Data-Driven Insights: A Proven Recipe Step 3: Wash and Chop (Clean the Data) 🔪 • We can’t cook with dirty veggies! Before cooking, we need to wash them and chop them into the right size for our recipe. • Data Version: In the same way, raw data is messy! Remove duplicates, handle missing values, and standardize formats. Just like chopping onions into fine pieces, we must structure our data properly for the best results. And yes, cleaning data might make you cry just like onions. 🧅😭 Step 4: Taste the Ingredients (Exploratory Data Analysis – EDA) 👅 • Before cooking, taste a little. At this stage, it’s crucial to check if the tomato is too sour or if the cheese has the right texture. Adjusting accordingly ensures a perfect final dish. • Data Version: Similarly, explore the data using visualizations and statistics. Look for trends, outliers, and patterns to ensure that our ingredients (data) will blend well in the final dish (insights). Otherwise, you might end up discovering that your dataset is 90% missing values—just like biting into an apple and finding it’s all seeds. 🍏😬
Data-Driven Insights: A Proven Recipe Step 5: Cook with Spices (Statistical Analysis & Modeling) 🌶️ • Now, add the right spices! This step is all about balance. Too much salt? The dish is ruined. Too little? It’s bland. Finding the perfect balance is key. • Data Version: Similarly, use statistical techniques and machine learning models to process the data. Just like adding spices in the right proportion, applying the right model (regression, clustering, classification) gives the best results. Choose wisely, or you might end up with data as confusing as a dish with both sugar and salt mixed in. 😵💫 Step 6: Let It Simmer (Interpret Results & Draw Conclusions) 🫕 • A good dish needs time to cook properly. To bring out the best flavors, let it simmer, absorb the spices, and transform into something delicious! • Data Version: Likewise, once the model runs, analyze the results carefully. Are they meaningful? Do they answer the initial problem? Don’t rush—interpreting insights correctly ensures accuracy. Otherwise, you’ll serve half-cooked conclusions that taste like raw potatoes. 🥔😅
Data-Driven Insights: A Proven Recipe Step 7: Plate It Beautifully (Data Visualization) 🎨 • Even the tastiest dish needs good presentation! No matter how good the dish tastes, a messy plate won’t excite anyone, but a well-arranged dish is mouth-watering! • Data Version: Likewise, use charts, graphs, and dashboards to present findings in a visually appealing way. A well-structured dashboard is like a beautifully plated dish—it grabs attention and makes understanding easier. Otherwise, your audience might look at your graphs like they’re staring at a bowl of mystery stew. 🤨🍛 Step 8: Serve and Enjoy! (Make Data-Driven Decisions) 🍽️ • Finally, serve the dish to your guests. The ultimate test is seeing how your guests react. Did they love it? Should you adjust the recipe next time? • Data Version: In the same way, present findings to stakeholders. Use insights to drive decisions, just like feedback on a dish helps improve future recipes. Ignoring insights is like serving burnt food and pretending it’s gourmet—good luck convincing your audience. 😂🔥
Thank You! Website www.nextgensoft.io Email Work With Us sales@nextgensoft.io hr@nextgensoft.io Follow us Contact Number +91 81284 66678 +91 96013 40723