Download
1 / 25
250 likes | 306 Views
A bright world, aerosols and the hydrological cycle. Joaquim Ballabrera Unitat de Tecnologia Marina, CSIC. 30.000 barceloneses mueren al año por la contaminación de la ciudad

E N D
A bright world, aerosols and the hydrological cycle Joaquim Ballabrera Unitat de Tecnologia Marina, CSIC
30.000 barceloneses mueren al año por la contaminación de la ciudad El codirector del Centro de Investigación en Epidemología Ambiental (CREAL) Jordi Sunyer explicó hoy que en el área metropolitana de Barcelona se registran anualmente 30.000 muertes relacionadas con la polución atmosférica, en el marco de la Jornada Europea de Ciudades y Regiones para la Mejora de la Calidad del Aire que se celebra en Barcelona. Published by La Razón on June 17, 2010.
The Keeling curve shows a steady increase in mean atmospheric CO2 concentration from about 315 ppm in 1958 to 385 ppm in 2008. The increase in atmospheric CO2 is considered to be largely due to the combustion of fossil fuels.
The rate of annual warming over the 1901–2000 period is estimated to be 0.078C/decade. Warming is not continuous but occurs principally over two periods (about 1920–45 and since 1975).
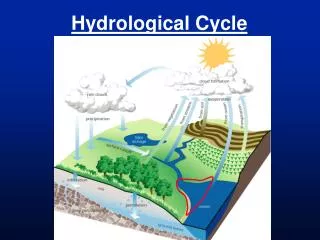
A warm atmosphere can hold much more water vapor than a cold one. The water carrying capacity of the air is given by the vapor pressure dependence on temperature (Clausius-Clapeyron). Other things being equal (winds, cloudiness etc) we may expect an intensification of the water cycle of 7% per degree of global warming. This means more intense droughts in some regions, stronger rainfall in others.
In many ways, society is more vulnerable to changes in the water cycle than to temperature changes alone.
There was a widespread reduction in solar radiation at the Earth’s surface, often referred to as global dimming, lasted from the mid-1950s until the mid-1980s when a recovery, referred to as global brightening, started.
Temporal dynamics of warm season (May–September) pan evaporation (mm) for China as a whole, 1955–2000. The thick line represents the pan evaporation trend with the rate (mm decade1) shown in the lower right corner of the chart. (Liu et al. 2004, JGR).
By increasing aerosol and cloud optical depth, anthropogenic emissions of aerosols and their precursors contribute to a reduction of solar radiation at the surface. Couplings Between Changes in the Climate System and Biogeochemistry, 4th Assessment Report of the IPCC panel (2007).
The net aerosol forcing over the 20th century from inverse estimates based on the observed warming likely ranges between –1.7 and –0.1 W m–2. Understanding and Attributing Climate Change, 4th Assessment Report of the IPCC panel (2007). Sometimes called “global dimming”, this phenomena has reversed since about 1990. Over the period 1984 to 2001, surface solar radiation has increased by about 0.16 W m–2 yr–1 on average (Pinker et al., 2005).
BEL IRE CHI AUS UK Records from six widely separated measurement sites show the reversal from global dimming to global brightening occurred almost simultaneously some 20 years ago. Why?
Besides the magnitude and scale of the observed changes, there are further globally observed indications: • Different trends between nighttime and daytime temperatures [Wild et al., 2007]; • Observations of pan-evaporation (reduction of evaporation while the world is warming up). Radiance, winds, convective reduction ? • Distinct patterns in ocean heat uptake (recent decreases since 2003). • All these phenomena are consistent with multidecadal variations in surface solar radiation. These changes observed at the surface can differ from radiative flux changes at the tropopause where forcings are typically calculated.
Clouds intercept both heat from the sun and heat radiated from the Earth. Their effects are complex and vary in time, location, and altitude. Usually during the daytime the interception of sunlight predominates, giving a cooling effect; however, at night the re-radiation of heat to the Earth slows the Earth's heat loss.
Approx. annual rates of sulfur transfer in Tg S CLOUDS AEROSOLS MSA DMS SO2 SO42- H2S Dry Dry Wet Dry Wet 8 Anth 70 16 Dry Wet ?? 1 OCEAN LAND VOLCANOES 224 (25 Anth) 130
The major removal process for sulphate aerosol rain, which is very effective. Water vapor residence time is about eight days. In the case of the sulphate aerosols in the atmosphere, the residence time is 5 days. L.D. Danny Harvey, Global Warming. The hard science, Prentice Hall, London, 2000.
The 2001 study by researchers at the Scripps Institution of Oceanography concluded that the imbalance between global dimming and global warming at the surface leads to weaker turbulent heat fluxes to the atmosphere. This means globally reduced evaporation and hence precipitation occur in a dimmer and warmer world, which could ultimately lead to a more humid atmosphere in which it rains less.
Light rain events Over the last 50 years, the southern part of eastern China has seen increased amounts of total rainfall per year. The northern half has seen less rain and more droughts. But light rainfall that sustains crops has decreased everywhere.