Download

1 / 43
430 likes | 583 Views
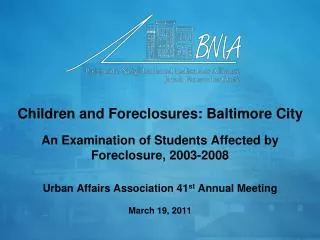
Baltimore City Tackling Chronic Absence. May 28, 2013. Panelists. Faith Connolly Executive Director, Baltimore Education Research Collaborative . Sue Fothergill Director, Baltimore Student Attendance Campaign. Molly McGrath Tierney, Director, Baltimore City Department of Social Services.

E N D
Baltimore City Tackling Chronic Absence May 28, 2013
Panelists Faith Connolly Executive Director, Baltimore Education Research Collaborative Sue Fothergill Director, Baltimore Student Attendance Campaign Molly McGrath Tierney, Director, Baltimore City Department of Social Services Karen Webber-NdourExecutive Director, Student Support and Safety, Baltimore City Schools
Baltimore City Public Schools By the Numbers • 85,000 public school students prekindergarten – 12th grade • 200 schools • 83% Free and Reduced Meals • 90% Average Daily Attendance • 31% Chronic Absence • 30% Highly Qualified Teachers • 32% Student Mobility • 88% African-American • 9% White • 3% Hispanic
Turning the Tide on AbsenteeismMay 28, 2013Karen Webber-Ndour, Executive DirectorOffice of Student Support and Safety
Early Strategies to Improve Attendance • Attendance and chronic absenteeism were included as components of District planning, messaging and reporting • Actively engaged families, communities and partners in the attendance work • Used data to demonstrate the importance of attendance on student achievement • Revised the Baltimore City Code of Conduct – suspensions contribute to chronic absence! • Prohibited suspensions for class cutting, lateness, absenteeism and truancy! • Reduced discretionary suspensions from 10 days to 5 days • Clearly messaged suspension as an alternative of last resort
Historical Suspension Data NOTE: Counts show total # of suspensions in the District SOURCE: Official MSDE files
Structural Strategies to Improve Attendance • Created more Grades PK-8 and Grades 6-12 schools • Consequently reducing the number of school transitions • Changed the middle school (i.e. Grades 6-8 schools) model to reflect District education priorities by implementing: • Smaller learning environments, often with thematic learning opportunities • A focus on literacy • Increased student and family options by creating Middle School Choice • Provided support for schools to improve attendance: • Developed the role of the attendance monitor • Updated attendance best practices and absentee protocols • Provided intensive annual training for attendance monitors
Chronic Absence rates declined across the district in SY11-12 NOTE: Data includes AOP Schools but NOT AOP Programs DATA SOURCE: MSDE Official files
Strategies to Improve Attendance NEXT STEPS 13 • Creating a bifurcated data-informed approach to attendance work • Focus on early grades with family-oriented attendance strategies • Focus on high school using strategies derived from student voice • Partnering with the Mayor of Baltimore City, Stephanie Rawlings Blake, to provide school-wide incentives for improved attendance • Robust media campaign to increase awareness and disseminate attendance information • Simplifying and distributing attendance best practices and expanding attendance training to administrators and teachers • Joining attendance work with district-wide School Climate efforts
Relationships Matter Positive relationships are critical to creating a positive school climate Types of relationships in schools: • Adult to Adult • Adult to Student • Student to Student Theory – school climate and relationships contribute to the school’s attendance
Climate Work • A cohort of 32 schools received Climate Training in the summer of 2012 • Climate Training included: • Defining and unpacking School Climate • School-specific suspension and attendance data • Individualized Climate plans for the SY1213 • The cohort of 32 schools have shown: • A greater reduction in YTD suspensions • A slight increase in YTD attendance rates • Chronic absence rates will be analyzed at end of SY 1213
The Campaign operates by: • Sharing best practices (frameworks & strategies) • Acting as an advisory board • Supporting data and research • Advocating for the implementation of attendance related policies and practices • Leveraging partners to promote and work on good attendance • Connecting the school district and individual schools to resources and information • Providing training and professional development The Baltimore Student Attendance Campaign
Baltimore’s Mayor and City Schools Chief Executive Officer established the Student Attendance Work Group. Open Society Institute – Baltimore funded researchers and a facilitator for the Work Group. The work group was charged with identifying and understanding causes of absenteeism and making recommendations for the removal of barriers to attendance. The work group involved over 100 public and private partners in the process. Topics analyzed included: laws, regulations, and policies that govern attendance, the prevalence of chronic absence, attendance best practices, transportation, health, homelessness, food and nutrition, data, youth voice, and parental engagement. Identify and Address Barriers to School Attendance
Student Attendance is a Community Priority *BCDSS = Baltimore City Department of Social Services
Advancing Community Schools Baltimore Baltimore Grade Level Reading Campaign Baltimore's Safe and Sound Campaign Maryland Out-of-School Time Network BUILD Baltimore Urban Debate League Family League of Baltimore City Elev8 Baltimore Experience Corp Higher Achievement The Gay, Lesbian & Straight Education Network Maryland Disability Law Center (MDLC) The Mayor's Office, Chief Services Coordinator The Perfectly Punctual Campaign Play Works Public Allies Public Justice Center Share Our Strength University of Baltimore - Truancy Court Wide Angle Youth Media The Baltimore Student Attendance Collaborative Twenty non-profit and public partners in 108 schools
Policy opportunities that have been identified in Maryland and Baltimore: • Increased after-school opportunities • Breakfast in the Classroom • Include pre-kindergarten and kindergarten in state reporting systems • Include kindergarten attendance data in school attendance measures for accountability • Utilize attendance data as a cross-cutting measure for planning • Focus on vulnerable populations of students • Students with two or more years of chronic absence • Students entering kindergarten without prior formal care • Students transitioning 5th – 6th grade and 8th – 9thgrade Advocate for Policies and Public Investment to Increase Student Attendance
Support from the Mayor and the District CEO to set the expectation that attendance is a city-wide priority Leverage Mayoral social and political capital to create a public attendance campaign including involving local celebrities and sponsoring events Utilize capital resources for school building projects that will help students and teachers feel valued while addressing facility deficiencies that can trigger absence like poor heating and ventilation (Spending $1.1 billion on school facilities improvements) Establish and strengthen partnerships between City agencies, non-profits and the school district such as data sharing agreements, leveraging of agency resources, and shared planning Nurture a Culture of Attendance
Attendance and Child Welfare Baltimore City May 28, 2013
Child Welfare is responsible for the well being of children in foster care and for the prevention of abuse and neglect. • Success is dependant on partnerships with organizations that are already in children’s lives – such as the public school system. • Attendance is a powerful data point for well-being and prevention. • Simple data sharing techniques help both social services and schools better care for vulnerable children. Priorities in Child Welfare
The school district provides the attendance rate of every child in foster care last month. • Social Services ensures a case worker intervenes with any child who’s attendance rate is below 85% Attendance rate of children ages 3 to 12 in foster care in Baltimore City for the past two years: 95% Well-being: Attendance for children in foster care
Upon request, the schools release the information on a child’s Emergency Contact Card. • Social Services asks those named on the card to be the foster care placement for the child. • Reduces trauma for children coming into foster care by placing them in a home with someone they already know, and • Helps ensure that coming into foster care does not mean you also change schools. • In Baltimore City = ~25% of placements. Well-being: School stability for children in foster care
Chronic absence in young children is a early warning sign of stress at home. • Schools provide data on children in Pre-k who are chronically absent from school. • Social Services visits and intervenes with prevention services. Month over month comparison shows young children do not re-appear in data after DSS Intervention Prevention: Attendance of young children in Baltimore
Early Elementary Performance and Attendance in Baltimore City Schools Pre-Kindergarten and Kindergarten
Repeating Patterns of Chronic Absence Percent CA in PreK (2006-07) Percent CA in K (2007-08)
CA in PreK & K and Attendance • Significant predictor of ADA and CA in later grades • Two to 3 times more likely to be retained before they reached third grade • Being CA in PreKonly has a smaller negative impact compared with CA in K
CA in PreK K and Achievement • Lower achievement scores in reading and math in G1 and G2, and lower math in G3 • Performance improved as students’ attendance improved • CA in PreK and K were more often identified to receive special education services in later grades
Implications • Patterns of low attendance established in PreK and K linger • Lower attendance leads to • lower performance, and • higher rates of retention, and • identification for Spec Ed services
Baltimore City Public SchoolsEfforts to Improve Early Grades Attendance • Partnership between Offices of Student Support and Safety, Engagement and Early Learning to develop cross cutting strategies • Early Grades Attendance Initiative • Parent Organizing Pilot Project • Training for prekindergarten and kindergarten teachers • Increased communication with parents about the importance of attendance in prekindergarten and kindergarten, connecting attendance with student learning
Attendance Messaging in Baltimore City • Every Day Counts…A Baltimore City Public Schools Attendance Messaging Campaign • Messages developed by students for students • The Mayor’s attendance competition