Download
1 / 25
250 likes | 384 Views
Practice-Based Evidence Research Model Predictors of Clinician Performance Risk Adjustment Comparative Effectiveness Research. AAOMPT Conference Anaheim, CA 2011 Dennis L. Hart, PT, PhD Director, Consulting and Research Focus On Therapeutic Outcomes, Inc. Knoxville, TN. TM.

E N D
Practice-Based Evidence Research ModelPredictors of Clinician PerformanceRisk AdjustmentComparative Effectiveness Research AAOMPT Conference Anaheim, CA 2011 Dennis L. Hart, PT, PhD Director, Consulting and Research Focus On Therapeutic Outcomes, Inc. Knoxville, TN TM Interactive Health Analysis Focus on Therapeutic Outcomes, Inc.
Faculty Affiliation & Disclosure • Affiliation • Director of Consulting and Research for FOTO. • Develops outcomes and other measures used in FOTO’s software to assist clinician’s ability to manage patients designed to improve their outcomes. • Publishes or assists in the publication of scientific endeavors related to analyses of the FOTO database. • Disclosure • Employee and investor in FOTO, a proprietary international medical/rehabilitation database management company. TM Interactive Health Analysis Focus on Therapeutic Outcomes, Inc.
The First Presentation • Describe predictors of physical therapy clinician performance identified using Practice-Based-Evidence (PBE) research designs. • PBE methods/designs allow development of comparative effectiveness research (CER) models. • CER uses advanced risk-adjustment to control for confounders and diverse patient case-mix for meaningful interpretation of results to identify which treatments are associated with better outcomes for which patients. TM Interactive Health Analysis Focus on Therapeutic Outcomes, Inc.
Background • FOTO is combining data from the U.S. and Israel looking for best practices. • Both countries are interested in public reporting, value-based purchasing and finding best practices. • Research teams are analyzing data from evidence-based practice from MDT and EIM trained clinicians. • As these data become risk-adjusted, they become the foundation for value-based purchasing and public reporting and become the foundation for comparative effectiveness research. TM Interactive Health Analysis Focus on Therapeutic Outcomes, Inc.
Predictors of Clinician Performance • To predict clinician performance, one needs data describing patients, clinicians and outcomes (etc!). • We collect and analyze real life clinical practice data. • Use of real life clinical data and their analyses are “Practice-Based Evidence for Clinical Practice Improvement Study Design” (PBE): Susan Horn, PhD. • PBE analyzes content and timing of individual steps of a health care process to determine how to achieve superior outcomes for the least necessary cost over the continuum of a patient’s care. TM Interactive Health Analysis Focus on Therapeutic Outcomes, Inc.
Predictors of Clinician Performance • Let’s look at some data from MDT trained clinicians. • N=743 patients with lumbar impairments. • Age 52 (17), 18 to 93: 57% female: 17% had surgery • 52% chronic symptoms • 40% had 4 or more comorbid conditions • 53% PPO or HMO (11% military, 3% WC) • 45% elevated somatization: 47% elevated depression • 27% elevated FABQ-PA • 41% CEN TM Interactive Health Analysis Focus on Therapeutic Outcomes, Inc.
Clinician Performance: Raw Data Discharge FS Therapists TM Interactive Health Analysis Focus on Therapeutic Outcomes, Inc. N=743, mean 106/therapist, range 31 - 288
Clinician Performance: Risk-Adjusted Predictions for Discharge FS RA Predicted Discharge FS Therapists TM Interactive Health Analysis Focus on Therapeutic Outcomes, Inc. N=448, R2 = 0.50, P<0.001
Clinician Performance: Raw & Risk-Adjusted Predicted Discharge FS Raw & RA Predicted Discharge FS Therapists TM Interactive Health Analysis Focus on Therapeutic Outcomes, Inc. N=448, R2 = 0.50, P<0.001
Clinician Performance: Risk-Adjusted Residuals for Discharge FS RA Residuals Discharge FS Therapists TM Interactive Health Analysis Focus on Therapeutic Outcomes, Inc. N=448, R2 = 0.50, P<0.001
Clinician Performance: Ratings by Raw vs. Risk-Adjusted Residuals for Discharge FS TM Interactive Health Analysis Focus on Therapeutic Outcomes, Inc.
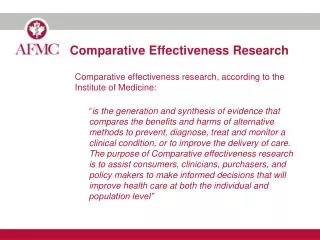
Risk Adjustment • Risk adjustment, also called ‘case-mix’ adjustment, is a statistical method used to control effects of confounding variables seen in patient populations. • Risk adjustment considers factors other than the health care intervention or processes of care that help explain variation in patient outcomes. • Without clinically appropriate and statistically sound risk adjustment, you cannot compare outcomes amongst clinicians in a meaningful manner. TM Interactive Health Analysis Focus on Therapeutic Outcomes, Inc.
Comparative Effectiveness Research • CER: which treatments are associated with better outcomes for which patients. • Deutscher, Horn, Dickstein, Hart et al, 2009 is the only paper I am aware of that describes a CER data analysis plan in outpatient rehab. • Observational study where all data are included. • Bias is present to some extent in all observational studies (systematic error from factors that influence the decision to treat and the outcomes of interest, like patient selection, confounding, misclassification, timing of measurements, loss of follow-up data). Dreyer NA et al Am J Man Care 2010 Dreyer NA et al Health Affairs 2010 TM Interactive Health Analysis Focus on Therapeutic Outcomes, Inc.
Controlling for Bias • Large, complete, diverse data sets. • Statistical risk-adjustment to reduce effects of bias. • Many variables (patient demographic, patient classification, clinic/clinician details, process, outcomes, timing of measurements) quantified. • Exacting operational definitions for each variable. • Variability in treatment. • Groups being compared should have a reasonable amount of overlap. Dreyer NA et al Health Affairs 2010 TM Interactive Health Analysis Focus on Therapeutic Outcomes, Inc.
Deutscher et al Results: Quick Review • Data set large: 54 outpatient facilities in Israel, of 57,008 patients, 22,019 (39%) had both intake and discharge data, diverse patients. • Many variables: patient characteristics, interventions, and outcomes. • Variability in treatments. • Operational definitions: working on it! • Groups had reasonable overlap in needs for treatment. • Multivariable linear regression models. Deutscher D et al Arch Phys Med Rehabil 2009 TM Interactive Health Analysis Focus on Therapeutic Outcomes, Inc.
Deutscher et al Results: Quick Review • Exploratory power of models: 30% to 39%. • Patient variables explained most variation in outcomes. • Better outcomes were associated with: patient compliance with self-exercise and therapy attendance, use of therapeutic exercise and manual therapy, completion of 3 or more outcomes surveys. • Worse outcomes were associated with: women, electrotherapy for pain, ultrasound for shoulder impairments, use of depression medication, longer waiting times before starting therapy. Deutscher D et al Arch Phys Med Rehabil 2009 TM Interactive Health Analysis Focus on Therapeutic Outcomes, Inc.
The MDT and PBE Studies • To improve patient outcomes: • Collect all data – No missing data. • Data must be risk adjusted. • Add variables to the risk-adjustment models. • Define everything you do, like treatments provided and methods of clinical examination. • Classify patients in meaningful ways. • Little difference between patients U.S. vs. Israel. • Follow the data, not the guru. • Integrate results into clinical practice. TM Interactive Health Analysis Focus on Therapeutic Outcomes, Inc.
EBP and Risk-Adjusted Outcomes • Evidence-Based Practice provides structure to patient examination and management. • EBP is the use of the current best science to help understand the patient for improved patient management and outcomes. • EBP has led to improved patient examination, which has led to better ways of classifying/grouping patients, and better ways of treating patients, for improved statistical modeling of outcomes. • Adding patient classification brings predictive power of FS outcomes models to 50%. TM Interactive Health Analysis Werneke MW et al JOSPT 2011 Focus on Therapeutic Outcomes, Inc.
Extraneous Variables • Observational studies have bias to some extent. • The trick is to describe and quantify the bias, so you can control the effect of the bias, which improves interpretation of results. • Outcome Confounder: Using MDT or TBC approaches direct treatment to specific subgroups of patients, which confounds outcomes. • Treatment Mediator: Clinical finding like elevated fear-avoidance that helps direct treatment but might not be a good predictor of FS outcomes. George SZ et al Spine 2003 Edmond SL et al JOSPT 2011 TM Interactive Health Analysis Focus on Therapeutic Outcomes, Inc.
Extraneous Variables • Observational studies have to some degree of bias. • The trick is to describe and quantify the bias, so you can control the effect of the bias, which improves interpretation of results. • Outcome Confounder: Using MDT or TBC approaches direct treatment to specific subgroups of patients, which confounds outcomes. • Treatment Mediator: Clinical finding like elevated fear-avoidance that helps direct treatment but might not be a good predictor of FS outcomes. George SZ et al Spine 2003 Edmond SL et al JOSPT 2011 TM Interactive Health Analysis Focus on Therapeutic Outcomes, Inc.
Extraneous Variables • Effect of treatment on outcomes. • Be prepared to recognize that treatment might not affect FS outcomes as much as we would like! • As predictive models evolve, current risk-adjustment variables control a large percent of FS outcomes data variance, so new variables add little to predictions. • Comorbidities: <2% additional variance control. • Fear-avoidance: <2% additional variance control. • Classification: ~50% additional variance control. Resnik L et al JCE 2010 Werneke MW et al JOSPT 2010 Hart DL et al JOSPT 2011 TM Interactive Health Analysis Focus on Therapeutic Outcomes, Inc.
0.14% gained Effect of Adding Variables:Comorbid Conditions & Fear 0.64% gained With FCI & Fear With FCI R2 Values Orthopedic/Lumbar: Functional Status Change Resnik L et al 2010; Hart DL et al 2011 TM Interactive Health Analysis Focus on Therapeutic Outcomes, Inc.
Doubled! Effect of Adding Patient Classification:Pain Pattern Classification R2 Values MDT Project Orthopedic/Lumbar: Functional Status Change Werneke MW et al 2010 TM Interactive Health Analysis Focus on Therapeutic Outcomes, Inc.
Conclusions • Have described predictors of physical therapy clinician performance using Practice-Based-Evidence (PBE) research designs. • Introduced CER and risk-adjustment to control for confounders for meaningful interpretation of results. • Demonstrated how we have identified which treatments are associated with better outcomes for which patients. • Be prepared to change your understanding of many issues related to patients, treatments, outcomes and payment. TM Interactive Health Analysis Focus on Therapeutic Outcomes, Inc.
Thank You hart@fotoinc.com TM Interactive Health Analysis Focus on Therapeutic Outcomes, Inc.