Download
1 / 33
330 likes | 455 Views
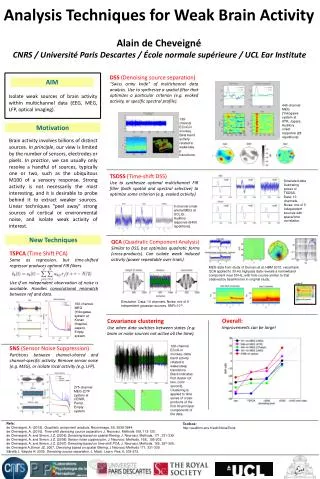
The Brain Activity Interpretation Competition 2006, sponsored by the University of Pittsburgh's Experience Based Cognition Group, challenged participants to use advanced techniques to infer subjective experiences from fMRI data collected while subjects viewed videos. With a diverse pool of 273 participants from 31 countries, the competition aimed to foster innovative methodologies in brain interpretation. Notable prizes included $10,000 for first place, exploring the interplay between brain activity and subjective feature ratings such as amusement, attention, and arousal.

E N D
Brain Activity Interpretation Competition 2006 Official Website http://www.ebc.pitt.edu/competition.html Sponsored by University of Pittsburgh Experience Based Cognition Group
Goals ofCompetition • To challenge groups to use state-of-the-art techniques to infer subjective experience from a set of fMRI data associated with passive viewing of videos. • Enable scientists to develop new brain interpretation methodologies. • To get the prize money • Prizes: $10,000 first place; $5,000 second place; $2,000 third place (US dollars)
Response to the Competition • 273 registered participants • From 31 countries (60% non-US) • From 161 institutions • •From 20 disciplines • 40 Teams submitted the results before the deadline
Basic Ideas of What to Do • Examine the brain activity and feature ratings of 3 people watching 3 twenty minute videos from a TV series (Home Improvement). • Develop classifier systems to predict the related feature rating data for movie 1 and movie 2. • Apply the classifier to the Movie3 brain activity data to predict the ratings of the people watching Movie3
Data Collection • Data was collected on 3 subjects viewing three videos while collecting eye movement data. • Rating data was collected on 13 features rated by each subject, plus 7 actor ratings and 7 location ratings and some processing of the video. (actor and location ratings are optional for predicting)
Data Collection Brain activation data 34x64x64x860 (1.75s) Subject and expert rating data 23x860(1.75 s) then convoled with a hemodynamic function Blank Screen
13 Basic Ratings to Predict • Amusement - How amusing is the content of the movie. • Attention - How attentive and engaged was the subject by the scene. • Arousal - How much did what was going on in the scene affect how calm the subject was. • Body Parts - Degree to which the subject saw and looked at body parts on the screen. • Environmental Sounds - Degree to which the subject heard sounds other than language, music and laugh track; • Faces - Degree to which the subject saw and looked at faces on the screen. • Food - Degree to which the subject saw food seen or eaten on the screen. • Language - Degree to which the subject heard or read language. • Laughter - Degree to which the subject heard the laugh track. • Motion - Degree to which the subject saw a person or an object moving in the scene; camera panning is not considered movement. • Music - Degree to which the subject heard music in the scene. • Sadness - How sad was the content of the scene to the subject. • Tools - Degree to which tools were seen and usedata to predict the ratings of the people watching Movie3 • Attention and Arousal have baseline level of 0.5, the rest rating has in 0.
Data Collection Movie 1 Subject 1 Arousal Movie 1 Subject 1 Amusement
Data Collection: Imaging Data • Scanner: Siemens 3T Allegra • Sequence: EpiBold • TR/TE: 1.75s / 25ms • Number of slices: 34 • xy image dimension: 64x64 voxels • The committee provides 3 types of images: • Original image, Pre-processed, Normalized+pre-processed
Developing Techniques • Try different pre-processing. • Feature selections • Train the classifier with movie 1, then validate the prediction with movie 2 or vice versa.
Pre-processing • De-trending • Spatial Smoothing • Grey matter masking one of the fMRI volumes of subject 1
Masking • Feature reduction to increase sensitivity • Select grey matter only Grey matter probability map
Detrending Detrend (linear) and set the mean to zero
Spatial Smoothing • Reduce noise • Smooth with the Gaussian kernel
Machine Learning/Regression • In the context of supervised learning Training set contains: Input vectors Targets (scalar) Model Function y(x) Basis Function
Machine Learning/Regression • Function y(w;x) is the linear combination of the basis functions, with the corresponding weights w. • The goal is to find good w which minimize the training error ξ. (g(t,y)is the cost function, the most common cost function is the sum of squares) as well as providing good generalization.
Machine Learning/Regression • For kernel methods (Support Vector Machine SVM, Relevance Vector Machine RVM, Gaussian Processes). The basis function uses the kernel function K(xn,xi). • We use only the linear kernel • K(xn,xi).=<xn,xi>=xnT xi
Kernel Matrix • The kernel matrix is generated from the fMRI volumes. Each image is treated as one feature vector x with D dimensions, which are the numbers of voxels. • The matrix is symmetric. Kni=<xn,xj > Kernel Matrix of subject 3 for movie 1. Kernel Matrix of subject 3 for 3 movies
Relevance Vector Regression • It is a Bayesian learning method • It generates sparse w (weighting vector) which in theory, generalizes the prediction better. • The prediction is probabilistic rather than point estimate. • Hyperparameters are introduced to provide prior distribution for the weight vector. • The formulation of prior distributions is a type of automatic relevance determination (ARD) model.
Relevance Vector Regression Model specification Where ε is the noise We encode a zero-mean Gaussian prior distribution function over w.
Relevance Vector Regression Where μis the posterior mean weights
Relevance Vector Regression In the simple case of uniform hyperpriors (p(α),p(β) both are flat) we need only maximise the term p(t|α,σ2) The hyperparameters are estimated from iterative steps.
Relevance Vector Regression Making Predictions Once the posterior mean μ is estimated, it can be used to predict the t* with new datum x* with
Relevance Vector Regression Making Predictions In our case, we use only linear kernel. Therefore, intuitively, the prediction can be realized as a dot product of the new image with the “sum of weighted training images”. w for language, subject 2, train with movie 2, Sum of weighted training images
Support Vector Regression • To find the w which minimize the training error as well as giving good generalization by minimizing || w ||2 in the same time. minimize subject to • The w is a weighted sum of all the training samples. • Only targets outside the error margin tube will contribute to the weighting vectors.
Post-processing • Constrained Quadratic Programming for deconvolution • Temporal smoothing Original Prediction of movie 1, subject 1, language. Correlation 0.8577 Deconvolved data constrained from 0 to 1. Reconvolved data Correlation 0.8699 Smoothed data Correlation 0.8854
Scoring • The prediction is correlated with the actual rating using Pearson’s correlation • Then each correlation is converted into Fisher’s z scoring. • The averaged z score is calculated from 13 basic rating and 3 subjects. The final score is the inverse of the average z score.
Our Results First Submission: Normalized Whole Brain with Support Vector Regression Z'Sub1 Z'Sub2 Z'Sub3 Avg Z' Inv Z' of AverageBase Features 0.419 0.493 0.508 0.474 0.441 Second Submission: Subject 1 – grey matter masked, smoothed, trained with the brain of 3 subjects together, RVR Subject 2 – normalized, preprocessed train with the brain of 3 subjects together, SVR Subject 3 - – normalized, preprocessed, trained only the brain of subject 3, RVR Z'Sub1 Z'Sub2 Z'Sub3 Avg Z' Inv Z' of AverageBase Features 0.505 0.478 0.535 0.506 0.467
Our Results Third Submission: Subject 1 – grey matter masked, smoothed, trained with the brain of 3 subjects together, RVR Subject 2 – grey matter masked, smoothed trained with the brain of 3 subjects together, RVR. Subject 3 - – normalized, preprocessed, trained only the brain of subject 3, RVR “Top” indicates top 5%
Acknowledgement Thanks for all the members in the team Dr. John Ashburner Dr. Janaina Mourao Miranda And Me Also people contribute the ideas Geoffrey Tan Demis Hassabis
BETA(ROI) ACTIVITY(ROI,Time) FEATURE(Time) Other Methods • Most are based on linear regression or ridge regression with high correlation ROI =