Download
1 / 34
340 likes | 474 Views
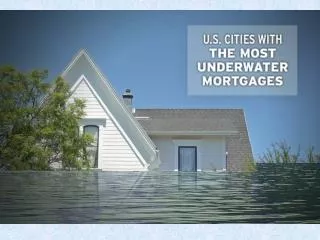
House values less than mortgage 2009. The Cities Most Underwater. For individual homeowners, being “underwater” on a mortgage – when a home is worth less than outstanding debt, or has “negative equity” – is one of the worst positions to be in, short of foreclosure. Zillow Home Values Index.

E N D
The Cities Most Underwater • For individual homeowners, being “underwater” on a mortgage – when a home is worth less than outstanding debt, or has “negative equity” – is one of the worst positions to be in, short of foreclosure.
Zillow Home Values Index • Included in the data is the “ Zillow Home Values Index ,” which represents the median measure of home valuations. According to Zillow’s Q3 report, the current median US home price is $190,414, down 6.9% from a year earlier. Almost one in five - 21% - of US homes are underwater, although this number has dropped from 23% from the second quarter of this year.
Total houses underwater in these 15 2,265,762
15. Tampa-St. Petersburg-Clearwater, Fla. • % of Homes with negative equity: 47.5% Homes with negative equity: 255,793 Zillow Home Value Index: $126,593 Year-over-year change: -16.6% Last time market was at current levels: Aug 2003 Change from market peak: -41.2%
14. Bradenton-Sarasota-Venice, Fla. • % of Homes with negative equity: 48.2% Homes with negative equity: 73,422 Zillow Home Value Index: $155,299 Year-over-year change: -14.3% Last time market was at current levels: Nov 2002 Change from market peak: -49.2%
13. Lakeland-Winter Haven, Fla. • % of Homes with negative equity: 49.2% Homes with negative equity: 51,927 Zillow Home Value Index: $112,381 Year-over-year change: -19.4% Last time market was at current levels: July 2004 Change from market peak: -39.7%
12. Bakersfield, Calif. • % of Homes with negative equity: 50.4% Homes with negative equity: 64,383 Zillow Home Value Index: $135,992 Year-over-year change: 19.5% Last time market was at current levels: Dec 2003 Change from market peak: -50.6%
11. Riverside-San Bernardino-Ontario, Calif. • % of Homes with negative equity: 58.5% Homes with negative equity: 397,634 Zillow Home Value Index: $189,121 Year-over-year change: -21.8% Last time market was at current levels: Dec 2002 Change from market peak: -53.0%
10. Cape Coral-Fort Myers, Fla. • % of Homes with negative equity: 60.5% Homes with negative equity: 82,457 Zillow Home Value Index: $120,261 Year-over-year change: -26.7% Last time market was at current levels: Oct 2001 Change from market peak: -59.9%
9. Vallejo-Fairfield, Calif. • % of Homes with negative equity: 61.1% Homes with negative equity: 46,353 Zillow Home Value Index: $216,918 Year-over-year change: 20.1% Last time market was at current levels: Jan 2001 Change from market peak: -54.2%
8. Orlando-Kissimmee, Fla. • % of Homes with negative equity: 62.3% Homes with negative equity: 239,759 Zillow Home Value Index: $137,301 Year-over-year change: -23.6% Last time market was at current levels: Jun 2003 Change from market peak: -46.5%
7. Reno-Sparks, Nev. • % of Homes with negative equity: 62.4% Homes with negative equity: 43,703 Zillow Home Value Index: $192,883 Year-over-year change: -19.4% Last time market was at current levels: Apr 2003 Change from market peak: -46.2%
6. Port St. Lucie, Fla. • % of Homes with negative equity: 62.5% Homes with negative equity: 60,108 Zillow Home Value Index: $121,240 Year-over-year change: -19.1% Last time market was at current levels: Sept 2002 Change from market peak: -52.1%
5. Phoenix-Mesa-Scottsdale, Ariz. • % of Homes with negative equity: 63.5% Homes with negative equity: 470,923 Zillow Home Value Index: $148,501 Year-over-year change: -22.2% Last time market was at current levels: Jul 2003 Change from market peak: -47.2%
4. Stockton, Calif. • % of Homes with negative equity: 66.9% Homes with negative equity: 74,939 Zillow Home Value Index: $154,501 Year-over-year change: -24.8% Last time market was at current levels: Oct 2000 Change from market peak: -62.4%
3. Modesto, Calif. • % of Homes with negative equity: 70.4% Homes with negative equity: 63,099 Zillow Home Value Index: $141,045 Year-over-year change: -22.7% Last time market was at current levels: Jan 2001 Change from market peak: -61.4%
2. Merced, Calif. • % of Homes with negative equity: 72.2% Homes with negative equity: 29,580 Zillow Home Value Index: $96,340 Year-over-year change: -38.9% Last time market was at current levels: Oct 1998 Change from market peak: -72.0%
1. Las Vegas-Paradise, Nev. • % of Homes with negative equity: 81.1% Homes with negative equity: 257,683 Zillow Home Value Index: $134,601 Year-over-year change: -31.6% Last time market was at current levels: Apr 2001 Change from market peak: -55.7%