Download
1 / 36
360 likes | 491 Views
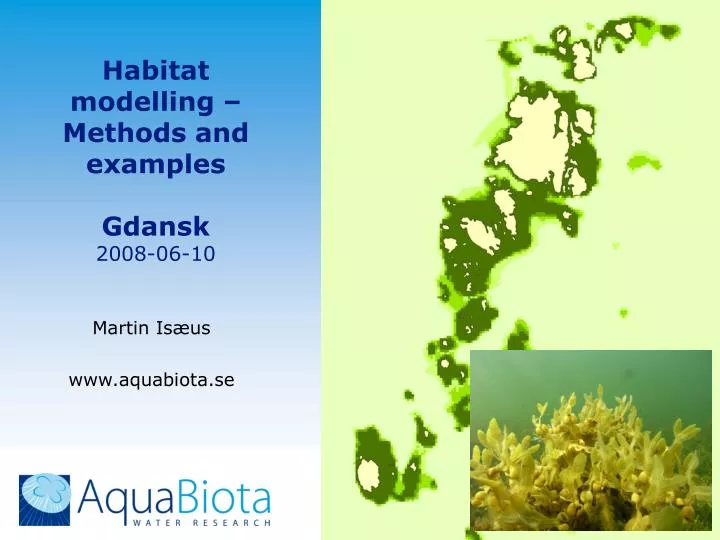
Habitat modelling – Methods and examples Gdansk 2008-06-10. Martin Isæus www.aquabiota.se. Wave exposure SWM Simplified Wave Model (Isaeus 2004). SWM 2007 Wave Exposure. Wave exposure SWM. Wave exposure SWM, recalculated to seafloor. EUNIS, 6 classes. EUNIS, 9 classes.

E N D
Habitat modelling – Methods and examples Gdansk2008-06-10 Martin Isæus www.aquabiota.se
Statistiskt samband GRASP, Maxent Modell Prediktion Spatial modelleing
Marine geology Blue – Till overlays sedimentary rockLight blue – tillOrange – Sand and gravel
Quality of bathymetry Sjökort Markallen R2 = 0.59 Multi-beam Persgrunden R2 = 0.95
Resolution of indata visible in outputFucus at Finngrunden, Bothnian Sea
VindValFiskGIS Presence of fish Stensnultra cvROC=0,843 ROC=0,889 cvCOR=0,63 COR=0,682
Probability of Blue mussel Foto Vattenkikaren
Cover of Fucus vesiculosus (Foto H. Kautsky)
Forsmark area, Bothnian Sea (SKB) Predator fish, biomass
Probability of Nephrops burrows (BALANCE) Spearman Corr 0.659
Why EUNIS? • HELCOM Ministerial Meeting 2007 – BSAP, Baltic marine habitat classification system by 2011 • EUNIS - EU Classification system, which also Russia is interested in • HELCOM Habitat Red List, BALANCE Marine Landscapes, Natura2000 habitats • National classifications (Eg. Baltic countries, Germany)
This initiative – to get the process started • Swedish Environmental Protection Agency (SEPA) • Working group: AquaBiota Water Research (Sweden), Alleco (Finland), Stockholm University (Sweden) • David Connor, JNCC (UK) • Workshop in Stockholm Mars 2007 with participants from Lithuania, Estonia, UK, Germany, Netherlands, Finland, Sweden
Top-down / Bottom-up • Biological relevance • Which parameters structure the biota? • Which biological assemblages occur? • Statistical analyses • System hierarchy • Comparable to other systems? • GIS layers available? • Manageable complexity? • Relevant for management? • BalMar – classification tool
Analyses aims • Describe species associations in Baltic phytobenthic communities • Test which environmental factors are important to explain these associations
Data • >300 diving transects from Swedish and Finnish coasts, >3200 data points • Cover of macroalgae, plants and sessile animals (common species) • Depth, substrate, wave exposure, salinity Analyses • Cluster and nMDS (species associations) • CCA (species-environment correlations)
”Salinity” % hard substrate Depth Species-environment correlation
Depth<1.5 Depth>1.5 Depth>0.6 Depth<7.3 Depth>7.3 Depth<0.6 n=234 Cla glo n=274 Fuc ves n=1173 Myt eduFur lumCer ten n=517 Myt eduSph arcRho con MVS for identification of categories Multivariate regression tree(MRT)
BalMar • Classification software using EUNIS criteria • Suggests habitat classes biological field data • Using dominant species for classifications, this method should be evaluated • When the method is agreed upon, data sets are classified rapidly
Discussion • Data not representing the whole Baltic
Conclusions • All 4 factors relevant, more data for class limits • Only phytobenthic data so far, need for deeper and more sheltered habitats, sediment • Acceptable EUNIS hierarchy • Need for better GIS layers - sediment, wave exposure whole Baltic, bathymetry, salinity
Next steps • Invite all Baltic nations, with data and participation in the process • A few workshops • Habitat descriptions, harmonisation between countries, conversion tables • Continuation of small group work • Funding for the continuation • Ready by 2011!
Examples on species distributions in relation to wave exposure
Wave models vs. Biological exposure index (BEI) BioEx R2 = 39.6 SWM R2 = 55.2 FWM R2 = 48.9 STWAVE R2 = 36.2
Utsjöbanksinventering 2 Falkens grund 2008-09 Ca 20 bankar Sydostbrotten Norra/Södra Långrogrundet Vernersgrund Eystrasaltbanken Sylen Finngrunden västra banken Campsgrund Argos yttergrund Grundskallegrunden Märketskallen Grisbådarna Svenska Björn Ursulas grund Klintgrund Kummelbank Utklippan Hanöbanken Klippbanken