Download
1 / 54
540 likes | 694 Views
Immunological Bioinformatics. Introduction to the immune system. Vaccination. Vaccination Administration of a substance to a person with the purpose of preventing a disease Traditionally composed of a killed or weakened micro organism

E N D
Immunological Bioinformatics Introduction to the immune system
Vaccination • Vaccination • Administration of a substance to a person with the purpose of preventing a disease • Traditionally composed of a killed or weakened micro organism • Vaccination works by creating a type of immune response that enables the memory cells to later respond to a similar organism before it can cause disease
Effectiveness of vaccines 1958 start of small pox eradication program
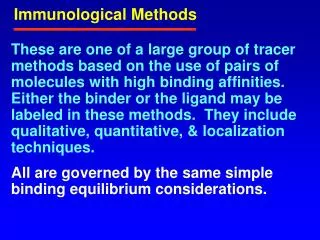
The Immune System • The innate immune system • The adaptive immune system
The innate immune system • Unspecific • Antigen independent • Immediate response • No training/selection hence no memory • Pathogen independent (but response might be pathogen type dependent)
The adaptive immune system • Pathogen specific • Humoral • Cellular Parasite http://tpeeaupotable.ifrance.com/ma%20photo/bilharzoze.jpg Bacteria Virus http://en.wikipedia.org/wiki/Image:Aids_virus.jpg http://www.uni-heidelberg.de/zentral/ztl/grafiken_bilder/bilder/e-coli.jpg
Adaptive immune response • Signal induced • Pathogens • Antigens • Epitopes B Cell T Cell
Diversity is a hallmark of the (adaptive) immune system • Diversity of lymphocytes • Huge diversity within a host • At least 108 different T & B cell clones • Receptors made by recombination & N-additions, and • Somatic mutation during immune response • Repertoires are (partly) random • Randomness requires self tolerance
Humoral immunity Cartoon by Eric Reits
Paratope Antibody - Antigen interaction Antigen The antibody recognizes structural properties of the surface of the antigen Fab Epitope Antibody
Antibody Effect Virus or Toxin Neutralizing Antibodies
Cartoon by Eric Reits Cellular immune response
MHC-I molecules present peptides on the surface of most cells
CTL response Virus- infected cell MHC-I Healthy cell
CTL response MHC-I Virus- infected cell
Polymorphism of MHC • Within a host limited number of loci (genes) • only 6 different class I molecules (two A, B and C) • only 12 different class II molecules • Within a population > 100 alleles per locus
More MHC molecules: more diversity in the presented peptides • 1% probability that MHC molecule presents a peptide • Different hosts sample different peptides from same pathogen.
Immunological benefits of MHC polymorphism • Heterozygote advantage • Heterozygotes have a selective advantage because they can present more peptides (Hughes.n88). • Coevolution • Pathogens avoid presentation on common MHC alleles (HIV) • Frequency dependent selection
Heterozygote disadvantage!(for vaccine design) • Few human beings will share the same set of HLA alleles • Different persons will react to a pathogen infection in a non-similar manner • A CTL based vaccine must include epitopes specific for each HLA allele in a population • A CTL based vaccine must consist of ~800 HLA class I epitopes and ~400 class II epitopes
HLA specificity clustering A0201 A6802 A0101 B0702
HLA polymorphism - supertypes • Each HLA molecule within a supertype binds essentially the same peptides • Nine major HLA class I supertypes have been defined • HLA-A1, A2, A3, A24,B7, B27, B44, B58, and B62 • And maybe add three more • HLA-A26, HLA-B8, and HLA-B39 • => A CTL based vaccine must consist of 9-12 HLA class I epitopes Sette et al, Immunogenetics (1999) 50:201-212
Summary • The adaptive immune system is extremely diverse • A immune responds can by raised against any thing foreign! • Antibodies defines the humoral response • Antibodies recognize structural properties on the surface of extra cellular antigens • T cells defines the cellular response • CTL’s kill cell that present MHC molecules bound with intra cellular derived foreign peptides
Anchor positions MHC class I with peptide
What makes a peptide a potential and effective epitope? • Part of a pathogen protein • Successful processing • Proteasome cleavage • TAP binding • Binds to MHC molecule • Protein function and expression • Early in replication • Highly expressed proteins are more likely to generate immunogens • Sequence conservation in evolution
Prediction of HLA binding specificityHistorical overview • Simple Motifs • Allowed/non allowed amino acids • Extended motifs • Amino acid preferences (SYFPEITHI) • Anchor/Preferred/other amino acids • Hidden Markov models • Peptide statistics from sequence alignment • Neural networks • Can take sequence correlations into account
SYFPEITHI predictions • Extended motifs based on peptides from the literature and peptides eluted from cells expressing specific HLAs ( i.e., binding peptides) • Scoring scheme is not readily accessible. • Positions defined as anchor or auxiliary anchor positions are weighted differently (higher) • The final score is the sum of the scores at each position • Predictions can be made for several HLA-A, -B and -DRB1 alleles, as well as some mice K, D and L alleles.
BIMAS • Matrix made from peptides with a measured T1/2 for the MHC-peptide complex • The matrices are available on the website • The final score is the product of the scores of each position in the matrix multiplied with a constant, different for each MHC, to give a prediction of the T1/2 • Predictions can be obtained for several HLA-A, -B and -C alleles, mice K,D and L alleles, and a single cattle MHC.
Sequence information SLLPAIVEL YLLPAIVHI TLWVDPYEV GLVPFLVSV KLLEPVLLL LLDVPTAAV LLDVPTAAV LLDVPTAAV LLDVPTAAV VLFRGGPRG MVDGTLLLL YMNGTMSQV MLLSVPLLL SLLGLLVEV ALLPPINIL TLIKIQHTL HLIDYLVTS ILAPPVVKL ALFPQLVIL GILGFVFTL STNRQSGRQ GLDVLTAKV RILGAVAKV QVCERIPTI ILFGHENRV ILMEHIHKL ILDQKINEV SLAGGIIGV LLIENVASL FLLWATAEA SLPDFGISY KKREEAPSL LERPGGNEI ALSNLEVKL ALNELLQHV DLERKVESL FLGENISNF ALSDHHIYL GLSEFTEYL STAPPAHGV PLDGEYFTL GVLVGVALI RTLDKVLEV HLSTAFARV RLDSYVRSL YMNGTMSQV GILGFVFTL ILKEPVHGV ILGFVFTLT LLFGYPVYV GLSPTVWLS WLSLLVPFV FLPSDFFPS CLGGLLTMV FIAGNSAYE KLGEFYNQM KLVALGINA DLMGYIPLV RLVTLKDIV MLLAVLYCL AAGIGILTV YLEPGPVTA LLDGTATLR ITDQVPFSV KTWGQYWQV TITDQVPFS AFHHVAREL YLNKIQNSL MMRKLAILS AIMDKNIIL IMDKNIILK SMVGNWAKV SLLAPGAKQ KIFGSLAFL ELVSEFSRM KLTPLCVTL VLYRYGSFS YIGEVLVSV CINGVCWTV VMNILLQYV ILTVILGVL KVLEYVIKV FLWGPRALV GLSRYVARL FLLTRILTI HLGNVKYLV GIAGGLALL GLQDCTMLV TGAPVTYST VIYQYMDDL VLPDVFIRC VLPDVFIRC AVGIGIAVV LVVLGLLAV ALGLGLLPV GIGIGVLAA GAGIGVAVL IAGIGILAI LIVIGILIL LAGIGLIAA VDGIGILTI GAGIGVLTA AAGIGIIQI QAGIGILLA KARDPHSGH KACDPHSGH ACDPHSGHF SLYNTVATL RGPGRAFVT NLVPMVATV GLHCYEQLV PLKQHFQIV AVFDRKSDA LLDFVRFMG VLVKSPNHV GLAPPQHLI LLGRNSFEV PLTFGWCYK VLEWRFDSR TLNAWVKVV GLCTLVAML FIDSYICQV IISAVVGIL VMAGVGSPY LLWTLVVLL SVRDRLARL LLMDCSGSI CLTSTVQLV VLHDDLLEA LMWITQCFL SLLMWITQC QLSLLMWIT LLGATCMFV RLTRFLSRV YMDGTMSQV FLTPKKLQC ISNDVCAQV VKTDGNPPE SVYDFFVWL FLYGALLLA VLFSSDFRI LMWAKIGPV SLLLELEEV SLSRFSWGA YTAFTIPSI RLMKQDFSV RLPRIFCSC FLWGPRAYA RLLQETELV SLFEGIDFY SLDQSVVEL RLNMFTPYI NMFTPYIGV LMIIPLINV TLFIGSHVV SLVIVTTFV VLQWASLAV ILAKFLHWL STAPPHVNV LLLLTVLTV VVLGVVFGI ILHNGAYSL MIMVKCWMI MLGTHTMEV MLGTHTMEV SLADTNSLA LLWAARPRL GVALQTMKQ GLYDGMEHL KMVELVHFL YLQLVFGIE MLMAQEALA LMAQEALAF VYDGREHTV YLSGANLNL RMFPNAPYL EAAGIGILT TLDSQVMSL STPPPGTRV KVAELVHFL IMIGVLVGV ALCRWGLLL LLFAGVQCQ VLLCESTAV YLSTAFARV YLLEMLWRL SLDDYNHLV RTLDKVLEV GLPVEYLQV KLIANNTRV FIYAGSLSA KLVANNTRL FLDEFMEGV ALQPGTALL VLDGLDVLL SLYSFPEPE ALYVDSLFF SLLQHLIGL ELTLGEFLK MINAYLDKL AAGIGILTV FLPSDFFPS SVRDRLARL SLREWLLRI LLSAWILTA AAGIGILTV AVPDEIPPL FAYDGKDYI AAGIGILTV FLPSDFFPS AAGIGILTV FLPSDFFPS AAGIGILTV FLWGPRALV ETVSEQSNV ITLWQRPLV
Calculate pa at each position Entropy Information content Conserved positions PV=1, P!v=0 => S=0, I=log(20) Mutable positions Paa=1/20 => S=log(20), I=0 Say that a peptide must have L at P2 in order to bind, and that A,F,W,and Y are found at P1. Which position has most information? How many questions do I need to ask to tell if a peptide binds looking at only P1 or P2? P1: 4 questions (at most) P2: 1 question (L or not) P2 has the most information Sequence Information
Information content A R N D C Q E G H I L K M F P S T W Y V S I 1 0.10 0.06 0.01 0.02 0.01 0.02 0.02 0.09 0.01 0.07 0.11 0.06 0.04 0.08 0.01 0.11 0.03 0.01 0.05 0.08 3.96 0.37 2 0.07 0.00 0.00 0.01 0.01 0.00 0.01 0.01 0.00 0.08 0.59 0.01 0.07 0.01 0.00 0.01 0.06 0.00 0.01 0.08 2.16 2.16 3 0.08 0.03 0.05 0.10 0.02 0.02 0.01 0.12 0.02 0.03 0.12 0.01 0.03 0.05 0.06 0.06 0.04 0.04 0.04 0.07 4.06 0.26 4 0.07 0.04 0.02 0.11 0.01 0.04 0.08 0.15 0.01 0.10 0.04 0.03 0.01 0.02 0.09 0.07 0.04 0.02 0.00 0.05 3.87 0.45 5 0.04 0.04 0.04 0.04 0.01 0.04 0.05 0.16 0.04 0.02 0.08 0.04 0.01 0.06 0.10 0.02 0.06 0.02 0.05 0.09 4.04 0.28 6 0.04 0.03 0.03 0.01 0.02 0.03 0.03 0.04 0.02 0.14 0.13 0.02 0.03 0.07 0.03 0.05 0.08 0.01 0.03 0.15 3.92 0.40 7 0.14 0.01 0.03 0.03 0.02 0.03 0.04 0.03 0.05 0.07 0.15 0.01 0.03 0.07 0.06 0.07 0.04 0.03 0.02 0.08 3.98 0.34 8 0.05 0.09 0.04 0.01 0.01 0.05 0.07 0.05 0.02 0.04 0.14 0.04 0.02 0.05 0.05 0.08 0.10 0.01 0.04 0.03 4.04 0.28 9 0.07 0.01 0.00 0.00 0.02 0.02 0.02 0.01 0.01 0.08 0.26 0.01 0.01 0.02 0.00 0.04 0.02 0.00 0.01 0.38 2.78 1.55
Sequence logos • Height of a column equal to I • Relative height of a letter is p • Highly useful tool to visualize sequence motifs HLA-A0201 High information positions http://www.cbs.dtu.dk/~gorodkin/appl/plogo.html
Characterizing a binding motif from small data sets 10 MHC restricted peptides • What can we learn? • A at P1 favors binding? • I is not allowed at P9? • K at P4 favors binding? • Which positions are important for binding? • ALAKAAAAM • ALAKAAAAN • ALAKAAAAR • ALAKAAAAT • ALAKAAAAV • GMNERPILT • GILGFVFTM • TLNAWVKVV • KLNEPVLLL • AVVPFIVSV
ALAKAAAAM ALAKAAAAN ALAKAAAAR ALAKAAAAT ALAKAAAAV GMNERPILT GILGFVFTM TLNAWVKVV KLNEPVLLL AVVPFIVSV Simple motifs Yes/No rules 10 MHC restricted peptides • Only 11 of 212 peptides identified! • Need more flexible rules • If not fit P1 but fit P2 then ok • Not all positions are equally important • We know that P2 and P9 determines binding more than other positions • Cannot discriminate between good and very good binders
Simple motifsYes/No rules 10 MHC restricted peptides • ALAKAAAAM • ALAKAAAAN • ALAKAAAAR • ALAKAAAAT • ALAKAAAAV • GMNERPILT • GILGFVFTM • TLNAWVKVV • KLNEPVLLL • AVVPFIVSV • Example • Two first peptides will not fit the motif. They are all good binders (aff< 500nM) RLLDDTPEV 84 nM GLLGNVSTV 23 nM ALAKAAAAL 309 nM
Fitness of aa at each position given by P(aa) Example P1 PA = 6/10 PG = 2/10 PT = PK = 1/10 PC = PD = …PV = 0 Problems Few data Data redundancy/duplication ALAKAAAAM ALAKAAAAN ALAKAAAAR ALAKAAAAT ALAKAAAAV GMNERPILT GILGFVFTM TLNAWVKVV KLNEPVLLL AVVPFIVSV Extended motifs RLLDDTPEV 84 nM GLLGNVSTV 23 nM ALAKAAAAL 309 nM
Sequence informationRaw sequence counting • ALAKAAAAM • ALAKAAAAN • ALAKAAAAR • ALAKAAAAT • ALAKAAAAV • GMNERPILT • GILGFVFTM • TLNAWVKVV • KLNEPVLLL • AVVPFIVSV
ALAKAAAAM ALAKAAAAN ALAKAAAAR ALAKAAAAT ALAKAAAAV GMNERPILT GILGFVFTM TLNAWVKVV KLNEPVLLL AVVPFIVSV Sequence weighting } Similar sequences Weight 1/5 • Poor or biased sampling of sequence space • Example P1 PA = 2/6 PG = 2/6 PT = PK = 1/6 PC = PD = …PV = 0 RLLDDTPEV 84 nM GLLGNVSTV 23 nM ALAKAAAAL 309 nM
Sequence weighting • ALAKAAAAM • ALAKAAAAN • ALAKAAAAR • ALAKAAAAT • ALAKAAAAV • GMNERPILT • GILGFVFTM • TLNAWVKVV • KLNEPVLLL • AVVPFIVSV
ALAKAAAAM ALAKAAAAN ALAKAAAAR ALAKAAAAT ALAKAAAAV GMNERPILT GILGFVFTM TLNAWVKVV KLNEPVLLL AVVPFIVSV Pseudo counts • I is not found at position P9. Does this mean that I is forbidden (P(I)=0)? • No! Use Blosum substitution matrix to estimate pseudo frequency of I at P9
The Blosum matrix A R N D C Q E G H I L K M F P S T W Y V A 0.29 0.03 0.03 0.03 0.02 0.03 0.04 0.08 0.01 0.04 0.06 0.04 0.02 0.02 0.03 0.09 0.05 0.01 0.02 0.07 R 0.04 0.34 0.04 0.03 0.01 0.05 0.05 0.03 0.02 0.02 0.05 0.12 0.02 0.02 0.02 0.04 0.03 0.01 0.02 0.03 N 0.04 0.04 0.32 0.08 0.01 0.03 0.05 0.07 0.03 0.02 0.03 0.05 0.01 0.02 0.02 0.07 0.05 0.00 0.02 0.03 D 0.04 0.03 0.07 0.40 0.01 0.03 0.09 0.05 0.02 0.02 0.03 0.04 0.01 0.01 0.02 0.05 0.04 0.00 0.01 0.02 C 0.07 0.02 0.02 0.02 0.48 0.01 0.02 0.03 0.01 0.04 0.07 0.02 0.02 0.02 0.02 0.04 0.04 0.00 0.01 0.06 Q 0.06 0.07 0.04 0.05 0.01 0.21 0.10 0.04 0.03 0.03 0.05 0.09 0.02 0.01 0.02 0.06 0.04 0.01 0.02 0.04 E 0.06 0.05 0.04 0.09 0.01 0.06 0.30 0.04 0.03 0.02 0.04 0.08 0.01 0.02 0.03 0.06 0.04 0.01 0.02 0.03 G 0.08 0.02 0.04 0.03 0.01 0.02 0.03 0.51 0.01 0.02 0.03 0.03 0.01 0.02 0.02 0.05 0.03 0.01 0.01 0.02 H 0.04 0.05 0.05 0.04 0.01 0.04 0.05 0.04 0.35 0.02 0.04 0.05 0.02 0.03 0.02 0.04 0.03 0.01 0.06 0.02 I 0.05 0.02 0.01 0.02 0.02 0.01 0.02 0.02 0.01 0.27 0.17 0.02 0.04 0.04 0.01 0.03 0.04 0.01 0.02 0.18 L 0.04 0.02 0.01 0.02 0.02 0.02 0.02 0.02 0.01 0.12 0.38 0.03 0.05 0.05 0.01 0.02 0.03 0.01 0.02 0.10 K 0.06 0.11 0.04 0.04 0.01 0.05 0.07 0.04 0.02 0.03 0.04 0.28 0.02 0.02 0.03 0.05 0.04 0.01 0.02 0.03 M 0.05 0.03 0.02 0.02 0.02 0.03 0.03 0.03 0.02 0.10 0.20 0.04 0.16 0.05 0.02 0.04 0.04 0.01 0.02 0.09 F 0.03 0.02 0.02 0.02 0.01 0.01 0.02 0.03 0.02 0.06 0.11 0.02 0.03 0.39 0.01 0.03 0.03 0.02 0.09 0.06 P 0.06 0.03 0.02 0.03 0.01 0.02 0.04 0.04 0.01 0.03 0.04 0.04 0.01 0.01 0.49 0.04 0.04 0.00 0.01 0.03 S 0.11 0.04 0.05 0.05 0.02 0.03 0.05 0.07 0.02 0.03 0.04 0.05 0.02 0.02 0.03 0.22 0.08 0.01 0.02 0.04 T 0.07 0.04 0.04 0.04 0.02 0.03 0.04 0.04 0.01 0.05 0.07 0.05 0.02 0.02 0.03 0.09 0.25 0.01 0.02 0.07 W 0.03 0.02 0.02 0.02 0.01 0.02 0.02 0.03 0.02 0.03 0.05 0.02 0.02 0.06 0.01 0.02 0.02 0.49 0.07 0.03 Y 0.04 0.03 0.02 0.02 0.01 0.02 0.03 0.02 0.05 0.04 0.07 0.03 0.02 0.13 0.02 0.03 0.03 0.03 0.32 0.05 V 0.07 0.02 0.02 0.02 0.02 0.02 0.02 0.02 0.01 0.16 0.13 0.03 0.03 0.04 0.02 0.03 0.05 0.01 0.02 0.27 Some amino acids are highly conserved (i.e. C), some have a high change of mutation (i.e. I)
What is a pseudo count? • Say I observe V at P1 • Knowing that V at P1 binds, what is the probability that a peptide could have I at P1? • P(I|V) = 0.16 A R N D C Q E G H I L K M F P S T W Y V A 0.29 0.03 0.03 0.03 0.02 0.03 0.04 0.08 0.01 0.04 0.06 0.04 0.02 0.02 0.03 0.09 0.05 0.01 0.02 0.07 R 0.04 0.34 0.04 0.03 0.01 0.05 0.05 0.03 0.02 0.02 0.05 0.12 0.02 0.02 0.02 0.04 0.03 0.01 0.02 0.03 N 0.04 0.04 0.32 0.08 0.01 0.03 0.05 0.07 0.03 0.02 0.03 0.05 0.01 0.02 0.02 0.07 0.05 0.00 0.02 0.03 D 0.04 0.03 0.07 0.40 0.01 0.03 0.09 0.05 0.02 0.02 0.03 0.04 0.01 0.01 0.02 0.05 0.04 0.00 0.01 0.02 C 0.07 0.02 0.02 0.02 0.48 0.01 0.02 0.03 0.01 0.04 0.07 0.02 0.02 0.02 0.02 0.04 0.04 0.00 0.01 0.06 …. Y 0.04 0.03 0.02 0.02 0.01 0.02 0.03 0.02 0.05 0.04 0.07 0.03 0.02 0.13 0.02 0.03 0.03 0.03 0.32 0.05 V 0.07 0.02 0.02 0.02 0.02 0.02 0.02 0.02 0.01 0.16 0.13 0.03 0.03 0.04 0.02 0.03 0.05 0.01 0.02 0.27
Pseudo count estimation • ALAKAAAAM • ALAKAAAAN • ALAKAAAAR • ALAKAAAAT • ALAKAAAAV • GMNERPILT • GILGFVFTM • TLNAWVKVV • KLNEPVLLL • AVVPFIVSV • Calculate observed amino acids frequencies fa • Pseudo frequency for amino acid b • Example
Weight on pseudo count • ALAKAAAAM • ALAKAAAAN • ALAKAAAAR • ALAKAAAAT • ALAKAAAAV • GMNERPILT • GILGFVFTM • TLNAWVKVV • KLNEPVLLL • AVVPFIVSV • Pseudo counts are important when only limited data is available • With large data sets only “true” observation should count • is the effective number of sequences (N-1), is the weight on prior
Weight on pseudo count • ALAKAAAAM • ALAKAAAAN • ALAKAAAAR • ALAKAAAAT • ALAKAAAAV • GMNERPILT • GILGFVFTM • TLNAWVKVV • KLNEPVLLL • AVVPFIVSV • Example • If large, p ≈ f and only the observed data defines the motif • If small, p ≈ g and the pseudo counts (or prior) defines the motif • is [50-200] normally
Sequence weighting and pseudo counts • ALAKAAAAM • ALAKAAAAN • ALAKAAAAR • ALAKAAAAT • ALAKAAAAV • GMNERPILT • GILGFVFTM • TLNAWVKVV • KLNEPVLLL • AVVPFIVSV RLLDDTPEV 84nM GLLGNVSTV 23nM ALAKAAAAL 309nM P7P and P7S > 0