Download
1 / 44
440 likes | 551 Views
Join us for an insightful seminar led by Louise Francis, FCAS, MAAA, as we explore dimension reduction methods and their applications in Workers' Compensation predictive modeling. Discover what dimension reduction is and why it’s vital in data analysis. We’ll introduce key techniques such as Principal Components Analysis and Factor Analysis, illustrated with real-world examples. This seminar will emphasize understanding the mechanisms behind these methods, fostering essential insights for actuaries and analytics professionals.

E N D
Dimension Reduction in Workers Compensation CAS predictive Modeling Seminar Louise Francis, FCAS, MAAA Francis Analytics and Actuarial Data Mining, Inc. Louise_francis@msn.com www,data-mines.com
Objectives • Answer questions: What is dimension reduction and why use it? • Introduce key methods of dimension reduction • Illustrate with examples in Workers Compensation • There will be some formulas, but emphasis is on insight into basic mechanisms of the procedures
Introduction • “How do mere observations become data for analysis?” • “Specific variable values are never immutable characteristics of the data” • Jacoby, Data Theory and Dimension Analysis, Sage Publications • Many of the dimension reduction/measurement techniques originated in the social sciences and dealt with how to create scales from responses on attitusional and opinion surveys
Unsupervised learning • Dimension reduction methods generally unsupervised learning • Supervised Learning • A dependent or target variable • Unsupervised learning • No target variable • Group like variables or like records together
The Data • BLS Economic indexes • Components of inflation • Employment data • Health insurance inflation • Texas Department of Insurance closed claim data for 2002 and 2003 • Employment related injury • Excludes small claims • About 1800 records
What is a dimension? • Jacoby – any information that adds significant variability • In many studies each variable is a dimension • However,we can also view each record in a database as a dimension
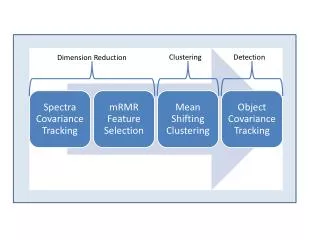
The Two Major Categories of Dimension Reduction • Variable reduction • Factor Analysis • Principal Components Analysis • Record reduction • Clustering • Other methods tend to be developments on these
Principal Components Analysis • A form of dimension (variable) reduction • Suppose we want to combine all the information related to the “inflation” dimension of insurance costs • Medical care costs • Employment (wage) costs • Other • Energy • Transportation • Services
Principal Components • These variables are correlated but not perfectly correlated • We replace many variables with a weighted sum of the variables • These are then used as independent variables in a predictive model
Factor/Principal Components Analysis • Linear methods – use linear correlation matrix • Correlation matrix decomposed to find smaller number of factors the are related to the same underlying drivers • Highly correlated variables tend to have high load on the same factor
Factor/Principal Components Analysis • Uses eignevectors and eigenvalues • R is correlation matrix, V eigenvectors, lambda eigenvalues
Factor Rotation • Find simpler more easily interpretable factors • Use notion of factor complexity
Factor Rotation • Quartimax Rotation • Maximize q • Varimax Rotation • Maximizes the variance of squared loadings for each factor rather than for each variable
How Many Factors to Keep? • Eigenvalues provide information on how much variance is explained • Proportion explained by a given component=corresponding eigenvalue/n • Use Scree Plot • Rule of thumb: keep all factors with eigenvalues>1
What About Categorical Data? • Factor analysis is performed on numeric data • You could code data as binary dummy variables • Categorical Variables from Texas data • Injury • Cause of loss • Business Class • Health Insurance (Y/N)
Optimal Scaling • A method of dealing with categorical variables • Uses regression to • Assign numbers to categories • Fit regression coefficients • Y*=f(X*) • In each round of fitting, a new Y* and X* is created
Row Reduction: Cluster Analysis • Records are grouped in categories that have similar values on the variables • Examples • Marketing: People with similar values on demographic variables (i.e., age, gender, income) may be grouped together for marketing • Text analysis: Use words that tend to occur together to classify documents • Fraud modeling • Note: no dependent variable used in analysis
Clustering • Common Method: k-means, hierarchical • No dependent variable – records are grouped into classes with similar values on the variable • Start with a measure of similarity or dissimilarity • Maximize dissimilarity between members of different clusters
Dissimilarity (Distance) Measure – Continuous Variables • Euclidian Distance • Manhattan Distance
Binary Variables • Sample Matching • Rogers and Tanimoto
Example: Texas Data • Data from 2002 and 200 3closed claim database by Texas Ins Dept • Only claims over a threshold included • Variables used for clustering: • Report Lag • Settlement Lag • County (ranked by how often in data) • Injury • Cause of Loss • Business class
Used squared distance measure Results Using Only Numeric Variables
Two Stage Clustering With Categorical Variables • First compute distances • Then get clusters • Find optimum number of clusters
Modern dimension reduction • Hidden layer in neural networks like a nonlinear principle components • Projection Pursuit Regression – a nonlinear PCA • Kahonen self-organizing maps – a kind of neural network that does clustering • These can be understood as enhancements factor analysys or clusterini