Download
1 / 28
280 likes | 402 Views
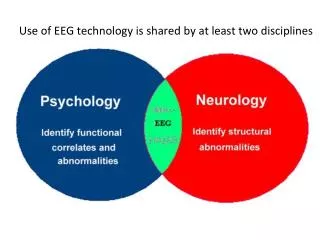
Discover the interdisciplinary uses of EEG technology shared by diverse fields beyond neuroscience, with historical insights, spectral analyses, and applications for evaluating brain activity and connectivity.

E N D
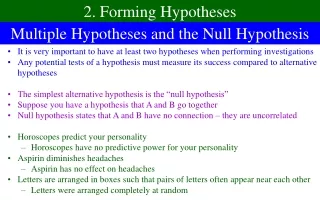
As EEG is used for different goals by different groups, the same is true for other tools such as hammers We do not require a gavel to be manufactured using specifications of a carpenter’s hammer
Survey of 2009 EEG papers on Medline for humans waking state, 25% clinical, 75% quantitative Over 40,000 QEEG papers since 1965 First QEEG paper = 1932 Dietsch (1932) analyzed EEG using discrete Fourier transforms (1831). Fast Fourier Transform (FFT) algorithm invented (Cooley & Tukey, 1965) , allowing practical spectral applications Dumermuth & Fluhler (1967) applied FFT to EEG
Frequency analysis Jean Baptiste Joseph Fourier(1768-1830)
Evaluation of cortical activity. Each brain map consists of 19 electrode sites evenly spaced across the head. Color indicates microvolts (data or raw view) or statistical deviation from a comparison group average (stat view). Spectral magnitude coefficients that exceed +/- 2 standard deviations are indicative of localized hyper- or hypo-excitability in cortical neuronal pools, depending upon the frequency of interest
SKIL Database Peer review publications of SKIL database Johnston et al, 2005 (Clinical EEG) Lorensen & Dickson, 2003 (J Neurotherapy) Mean 28.2 years+/- 6.4 years 75% male n=135 using replicated files from each participant
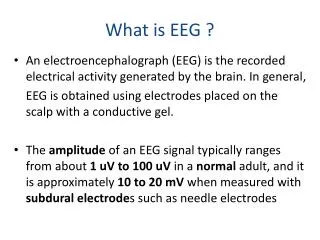
Why amplify? • 102 volts - Wall socket • 10-3 volts - EKG • (millivolts) • 10-5 volts – EOG • 10-6 volts – EEG • (microvolts)
Sources of Artifact • Equipment • Computational • Neural, non-cerebral (muscle) • Neural, cerebral, mixed states • alertness changes, sleep, unstable background • transients • Inferential • Improper mental processes • Improper frequency correspondence
Brain Maturation 4-8 Hz 8-12 Hz Healthy Child Healthy Adult
The more neurons recruited into a rhythm, the higher the spectral magnitude (or power)
Time delay between brain areas recruited into the same rhythm is indicated by phase
How to show 361 (19x19) site-pairs Raw Data VIEWS Statistical
Behavioral differences from norma Activity Connectivity
Frequency informationlocalized and shared • Coherence • (Wiener, 1930; Goodman, 1957; Walter, 1968) • Comodulation • (Pearson, 1896; Kaiser, 1994)
Signals are … …coherent when phase difference is stable …comodulated when magnitude difference is stable