Modeling Clinoforms Created by Wave/Current-Supported Gravity Flows
170 likes | 287 Views
Development and application of the Wave and Current Supported Sediment Gravity Flow Analytical Model for coastal sediment transport analysis, with focus on the Eel River shelf, CA. Includes equations, observations, and comparisons with real-world data.

Modeling Clinoforms Created by Wave/Current-Supported Gravity Flows
E N D
Presentation Transcript
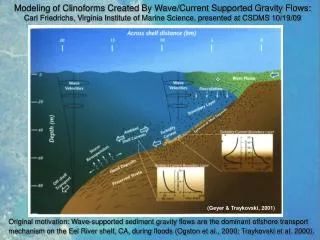
Modeling of Clinoforms Created By Wave/Current Supported Gravity Flows: Carl Friedrichs, Virginia Institute of Marine Science, presented at CSDMS 10/19/09 (Geyer & Traykovski, 2001) Original motivation: Wave-supported sediment gravity flows are the dominant offshore transport mechanism on the Eel River shelf, CA, during floods (Ogston et al., 2000; Traykovski et al. 2000).
Buoyancy Shear c dz Richardson Number d = = Critical value C = 0 Wave and Current Supported Sediment Gravity Flow Analytical Model (WSGFAM): (Friedrichs, Wright, Scully, Ma 2001 - 2009) x = local down-slope direction z z = d c z = 0 y a (i) Momentum balance: x B = depth-integrated buoyancy anomaly (i.e., suspended sediment) cd = drag coefficient = 0.003 Down-slope pressure gradient = Bottom friction a B = cd Umax ugrav Umax = (Uw2 + vc2+ ugrav2)1/2 (ii) Maximum turbulent sediment load: (iii) Solve for ugrav (iv) Deposition = – d/dx (B ugrav) – (B ugrav)/r r = radius of curvature of local bathymetric contour downslope lateral convergence convergence = +
D porosity p = 0.9, g = 9.8 m/s2, s = (rsed/rwater -1) = 1.6 Application of WSGFAM to Eel River shelf, CA (Scully, Friedrichs, Wright, 2002) (iii) Solve for ugrav Comparison of analytical solution to observed across-shelf velocity: (Observations from Ogston et al. 2000) Umax = (waves2 + currents2)1/2 Julian Day 1996 (iv) Deposition = d/dx (B ugrav) (neglecting lateral convergence in this case) Comparison of analytical solution to observed deposition: (Observations from Traykovski et al. 2000)
(Wheatcroft & Borgeld, 2000) Observed Observed Comparison of WSGFAM results to observed seasonal deposition on Eel shelf, Northern California: Modeled (Scully, Friedrichs Wright, 2003) Comparison WSGFAM results to observed seasonal deposition on Po subaqueous delta, NW Adriatic Sea: (Wheatcroft et al., 2006) (Friedrichs & Scully, 2007)
Distinct evolution of Po distributaries: Pila vs. Tolle (post 1880) -- Pila prograded as an equilibrium form, while Tolle eroded and steepened near shore -- Carminati & Martinelli (2002) suggest Po delta is subsiding by up to several cm/year ~ 35 m/yr Maestra 1% Po Delta Total sediment load 15 million tons/year Pila 74% Bathymetric profile figures from Nelson (1970) Tolle 7% Gnocca 11% Goro 8%
Century-scale modeling of subsiding delta (Friedrichs and Scully, 2007) 0 “Pila” -5 -10 ~ 35 m/yr 2000 1860 Depth (m) -15 -20 Qriver = 0.2 kg/m/s x 30 days/yr = 500,000 kg/m/yr -25 -30 0 1 2 3 4 5 6 7 8 9 10 Subsidence of 2 cm/yr Distance (km) 0 “Tolle” -5 -10 Depth (m) -15 -20 Qriver = 0.04 kg/m/s x 30 days/yr = 100,000 kg/m/yr -25 -30 0 1 2 3 4 5 6 7 8 9 10 Distance (km) -- Sediment load overwhelms subsidence off Pila, and delta evolves toward equilibrium -- Subsidence overwhelms sedimentation near shore off Tolle, steepening delta near shore
h P D S 2. Maximum Turbulent Sediment Load: 1. Momentum Balance: a B = cd Umax ugrav 3. Prograding Equilibrium Condition: 4. Conservation of Mass: (Friedrichs and Wright, 2005)
h P D S Accommodation space from subsidence, Riverine sediment supply, Qr Equilibrium bed slope () is controlled by: General Equilibrium Solution Underlying shelf depth, Wave orbital velocity, uw (Friedrichs and Wright, 2005)
h P D S Accommodation space from subsidence, Riverine sediment supply, Qr Equilibrium bed slope () is controlled by: General Equilibrium Solution Underlying shelf depth, Wave orbital velocity, uw Depositional slope cannot be larger than = cd/Ric ≈ 0.012 - 0.016 . For > 0.012 - 0.016, turbidity current will be auto-suspending and erosional. (Friedrichs and Wright, 2005)
h P D S Accommodation space from subsidence, Riverine sediment supply, Qr Equilibrium bed slope () is controlled by: General Equilibrium Solution Underlying shelf depth, Wave orbital velocity, uw First consider waves on landward, bypassing portion of profile with no subsidence. For wind waves, substitute in uw = (H/2) (sinh kh)-1 , where H is wave height, is wave radian frequency and k is wave number. (Friedrichs and Wright, 2005)
Equilibrium bypassing solution: Model trends for bathymetry: Observed bathymetries: (Friedrichs & Wright, 2004) -- Only variable quantities are wave height, river discharge (H3/Qr) and wave period (T). -- H and T tend to be positively correlated, so H3/Qr is the dominant environmental parameter. (Friedrichs & Wright, 2004)
h P D S Accommodation space from subsidence, Riverine sediment supply, Qr Equilibrium bed slope () is controlled by: General Equilibrium Solution Underlying shelf depth, Wave orbital velocity, uw (Friedrichs and Wright, 2005)
h P D S Accommodation space from subsidence, Riverine sediment supply, Qr Equilibrium bed slope () is controlled by: Underlying shelf depth, Wave orbital velocity, uw Next consider a delta profile prograding across a flat shelf with no subsidence. (Friedrichs and Wright, 2005)
Pila mouth of Po: Present day slope and theoretical equilibrium -5 Pila -10 EquilibriumProfile Hsig = 1 m, T = 6 s Qriver = 0.2 kg/m/s Depth (m) 45˚N -15 -20 = 28 m Bathymetry from Correggiari & Trincardi -25 4 8 12 -30 16 20 0 1 2 3 4 5 6 7 8 9 10 24 28 20 44.9 EquilibriumAnnualDeposition Flood duration = 3 weeks Bed porosity = 0.6 Progradation rate = 12 m/year 15 Deposition (cm) 10 5 44.8 12.4 12.5 12.6 12.7˚ E 0 0 1 2 3 4 5 6 7 8 9 10 Distance (km) Pila subaqueous delta is close to equilibrium solution for reasonable model parameters (Friedrichs and Wright, 2005)
Effects of (a) longer wave period (waves to tides) and (b) increased tidal range on equilibrium bathymetric profiles: (a) -5 Pila case -10 -15 EquilibriumProfiles Hsig = 1 m, Qriver = 0.2 kg/m/s T = 12 hr (tide) Depth (m) T = 6 s -20 T = 12 s -25 = 28 m -30 1 10 100 (b) -5 -10 Tidal range = 4 m Tidal range = 2 m -15 Tidal range = 1 m Equilibrium Tidal Profiles Qriver = 1 kg/m/s -20 Depth (m) -25 -30 -35 = 40 m -40 10 100 1000 Distance (km) (Friedrichs and Wright, 2005) Width of equilibrium subaqueous delta increases with wave period or tidal range (c.f. Walsh et al. 2003; Vakarelov et al. 2008)
D = S h e.g., Mid-shelf depocenter, Eel shelf P S(x) Riverine sediment supply, Qr Equilibrium bed slope () is controlled by: Accommodation space from subsidence, Underlying shelf depth, Wave orbital velocity, uw -- Deposition is determined by subsidence (i.e., shape of accommodation space). -- Subsidence reduces profile slope but equilibrium slope is independent subsidence details. (Friedrichs and Wright, 2005)
Eel River shelf, CA: (Orange, 1999) (Scully et al., 2003, showing 95-97 depocenter) -- Deposition lines up with syncline (subsidence) and shallower mid-shelf slope -- Bypassing lines up with anticline (uplift) and steeper mid-shelf slope