Download
1 / 10
100 likes | 202 Views
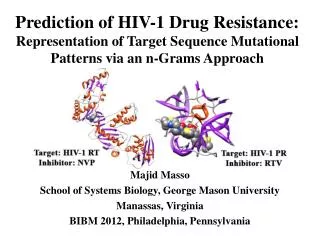
Prediction of HIV-1 Drug Resistance: Representation of Target Sequence Mutational Patterns via an n-Grams Approach. Majid Masso School of Systems Biology, George Mason University Manassas, Virginia BIBM 2012, Philadelphia, Pennsylvania. Graphical Outline of Presentation.

E N D
Prediction of HIV-1 Drug Resistance:Representation of Target Sequence Mutational Patterns via an n-Grams Approach Majid Masso School of Systems Biology, George Mason University Manassas, Virginia BIBM 2012, Philadelphia, Pennsylvania
HIV-1 Protein Sequence Datasets • Data available from Stanford HIV Drug Resistance Database • 548 protease (PR) and 331 reverse transcriptase (RT) sequences with distinct mutational patterns defined by residue substitutions • For each of 8 PR and 11 RT inhibitors, PhenoSense assay used to measure degree to which mutant target proteins are susceptible • PR/RT genotyping much faster and cheaper than phenotyping • Hence accurate predictive models of drug susceptibility only from target sequence are in high demand • Here we develop 19 inhibitor-specific predictive classification and regression models trained on the available phenotype data
HIV-1 Protein Sequence Datasets a. S, sensitive; I, intermediate; R, resistant
Sequence Feature Vectors Using n-Grams • Used successfully by other groups for sequence representation to study proteins; first application in this context (HIV-1 PR/RT) • Each of the 19 inhibitor sequence datasets encoded separately • Relative frequency method: sliding window of size n = 2 captures all ordered 2-grams of the seqs; calc. rel. freq. for all 400 types of 2-grams; represent each seq. as ordered vector of rel. freqs. • Counts method: each seq. represented as a 400-dim. vector, each component represents a specific 2-gram type whose value is the absolute freq. of its occurrence in that seq. • Dataset sequences have inhibitor susceptibility (phenotype) values (regression models), which can be be placed into 3 (S/I/R) groups (classification models)
Classification and Regression Models • Algorithms: random forest (RF) for classification, reduced-error pruned tree (REPTree) for regression, implemented in Weka • Testing: stratified tenfold cross-validation applied to each dataset • Reported results on each dataset: • RF classification: accuracy (% correct), out-of-bag (OOB) error, balanced error rate (BER), area under ROC curve (AUC) • REPTree regression: corr coeff (r2), mean-squared error (mse), accuracy (% correct) based on where predicted numerical susceptibility values fall relative to S/I/R category thresholds
Accuracy Results Rhee, et al. (Stanford) 0.78 0.76 0.83
Information-Rich REPTree Attributes (Protease Inhibitors) • Based on relative frequency method for generating sequence feature vectors • Node attribute i is a vector component number, whose value is the rel. freq. for the (i, i + 1) sequence 2-gram • Ex.: root node 10 for APV corresponds to PR sequence positions (10, 11), and at least one of these is known to be an important drug resistance position (10 is in both IAS and TSM subsets) (Nucleoside / Nucleotide RT Inhibitors) (Non-nucleoside RT Inhibitors) a. Regular font, both IAS and TSM sets of positions; bold, TSM only; underlined, neither.
Application: Drug Cocktail Effectiveness • Used relative frequency method and REPTree regression • Train with one inhibitor dataset, test with another • High corr coeff (r) between actual and predicted susceptibility values on test set both inhibitors (train and test sets) have similar resistance patterns and/or likely not good taken together • Low or slightly negative r potentially good in combination Known bad pairing Known good pairing 3TC/ABC or FTC/ABC pairs are effective, but high risk of severe adverse events that require stoppage Shaded areas: NRTI/NNRTI pairs (known good together) Two NNRTIs should NOT be taken together (based on clinical trials)
Acknowledgements and References • Thanks tothe Stanford HIV Drug Resistance Database (http://hivdb.stanford.edu/) for the genotype-phenotype correlation data characterizing HIV-1 PR and RT sequences • This study was inspired by Rhee, et al., PNAS (2006) • Effective cocktails, and drugs not to co-administer, based on Antiretroviral Guidelines for Adults and Adolescents from the U.S. Department of Health and Human Services: http://www.aidsinfo.nih.gov/ContentFiles/AdultandAdolescentGL.pdf