Download

1 / 44
440 likes | 580 Views
STAAR TREK. ILT January 18, 2011. Desired outcomes. Increase understanding of changes to the state accountability system for 2011 and beyond Raise level of awareness of changes to the state assessment system for 2012 and beyond Consider steps to address these changes.

E N D
STAAR TREK ILT January 18, 2011
Desired outcomes • Increase understanding of changes to the state accountability system for 2011 and beyond • Raise level of awareness of changes to the state assessment system for 2012 and beyond • Consider steps to address these changes
State testing and accountability systems overview Old system 1994-2002 TAAS 2003 TAKS Current system 2004-2011 TAKS 2012 STAAR New system 2013-???? STAAR
Learning standards What students should know and be able to do e.g. TEKS Performance (testing) standards Cut scores used to define performance ranges for individual students e.g. Panel Recommended Standard, Commended Performance Accountability standards Cut points of aggregate student performance used to assign ratings to educational organizations e.g. 70% met standard = Academically Acceptable Standards, schmandards
Key state accountability changes for 2011 TAKS-M and TAKS-Alt included Increased AA standard for math (65) and science (60) New commended performance indicator Recognized 15%, Exemplary 25% New ELL Progress indicator Recognized or Exemplary 60% TPM??? Student race/ethnicity subgroups???
Key state accountability changes for 2011 New race/ethnicity categories TBD PEIMS Student Demographics Accountability Groups Prior to 10-11 10-11 and beyond Prior to 2011 2011 and beyond
Accountability beyond 2011 • 2012 (first year for STAAR) • No campus/district accountability ratings • 2011 ratings will stand for 2 years • Kudos and sanctions • No SSI retest opportunities • STAAR results (3-8) not released until fall 2012 (performance standards set over the summer) • Aggregate STAAR results will be available at district, campus and classroom levels through new data portal
Performance schmandards Panel Recommended Commended Performance TAKS Did not meet standard Met Standard Commended Satisfactory Performance STAAR 3-8 Readiness Unsatisfactory? Satisfactory Advanced Minimum Performance Satisfactory Performance STAAR EOC Readiness Unsatisfactory? Satisfactory Advanced Gray area
Accountability beyond 2011 • 2013 - new accountability system • Based on new performance standards • Satisfactory performance • Will likely be phased in (e.g. 2 SEM, 1 SEM) • Readiness standards • Will NOT be phased in • Student progress indicator • Rating categories for districts / campuses • Unacceptable / Acceptable • Based on satisfactory performance
Accountability beyond 2011 • 2014 - Distinction designations • Categories - Recognized / Exemplary • Based on readiness performance standards • Other Measures (campus only) • Top quartile in annual improvement • Top quartile in closing performance gaps • Four other areas of distinction • Fine arts • Physical education • 21st century workforce development • Second language acquisition
Accountability schmandards 70% met standard 80% met standard 90% met standard Current system Unacceptable Acceptable Recognized Exemplary New basic rating (starts 2013) ??% met satisfactory performance Unacceptable Acceptable Readiness distinction (starts 2014) ??% met readiness standard ??% met readiness standard No distinction awarded Recognized Exemplary
Know the assessment • What do students need to know or be able to do to be successful on the items? • For which grade level is the item most appropriate?
In 1990, tuition at Britton Pre-School was $300 per pupil. According to this graph, how much money was collected in 1990? A $9000 B $900 C $600 D $6000 1. Read graph (30 pupils in 1990) 2. Multiply (30 pupils x $300/pupil)
The student council sponsor is planning to make a circle graph showing the number of votes for each of the candidates for student council president. The table below indicates the name and the vote count for each candidate. What central angle should the sponsor use for the section representing the votes for the student who finished in third place? A 54º B 72 º C 90 º D 126 º 1. Read table and compare numbers to determine who finished in third place 2. Add to find the total number of votes 3. Set up and solve proportion Bridget’s votes (240) X degrees = Total votes (1200) 360 degrees
Which state exports the least amount of crude oil monthly? A Louisiana B Texas C Alaska D Pennsylvania 1. Read pictograph to find state with fewest barrels
The graph shows the types and amounts of solid waste produced in the United States in 1998. What percent of the total solid waste was paper? A 33 1/3% B 40% C 66 2/3% D 72% 1. Read table and find the number of tons of paper waste 2. Divide the tons of paper waste by the total waste given 3. Convert decimal to percent
Know the assessment • With which exit-level assessment is each item associated? • TABS Grade 10 (1982) • TEAMS Grade 10 (1986) • TAAS Grade 10 (1999) • TAKS Grade 11 (2002 field test) • STAAR Algebra II (2012?)
In 1990, tuition at Britton Pre-School was $300 per pupil. According to this graph, how much money was collected in 1990? A $9000 B $900 C $600 D $6000 TEAMS Grade 10 (1986) 1. Read graph (30 pupils in 1990) 2. Multiply (30 pupils x $300/pupil)
The student council sponsor is planning to make a circle graph showing the number of votes for each of the candidates for student council president. The table below indicates the name and the vote count for each candidate. What central angle should the sponsor use for the section representing the votes for the student who finished in third place? A 54º B 72 º C 90 º D 126 º TAKS Grade 11 (2002) 1. Read table and compare numbers to determine who finished in third place 2. Add to find the total number of votes 3. Set up and solve proportion Bridget’s votes (240) X degrees = Total votes (1200) 360 degrees
Which state exports the least amount of crude oil monthly? A Louisiana B Texas C Alaska D Pennsylvania 1. Read pictograph to find state with fewest barrels TABS Grade 10 (1982)
The graph shows the types and amounts of solid waste produced in the United States in 1998. What percent of the total solid waste was paper? A 33 1/3% B 40% C 66 2/3% D 72% TAAS Grade 10 (1999) 1. Read table and find the number of tons of paper waste 2. Divide the tons of paper waste by the total waste given 3. Convert decimal to percent
STAAR overview • Assessments • Grades 3-8 • Same subjects as TAKS • R & M vertically linked to English III and Algebra II • Grades 9-12 • 12 end-of-course assessments • Minimum performance required on all EOCs for graduation • English III and Algebra II performance will determine diploma status (e.g. DAP, RHSP)
STAAR administration details • STAAR Accommodated not a separate form • STAAR Modified • Not available for Algebra II, chemistry, physics • Will have embedded field test items • STAAR Alternate will be available • STAAR L for ELLs administered online • Online oral administration
Other STAAR details • STAAR items will be field tested on TAKS in 2011 • Phase-in of satisfactory performance standard (e.g. 2 SEM, 1 SEM), but not readiness standard • May adopt a time limit (but still not a timed test) • Remediation required for any student failing a STAAR assessment (3-8 and EOC) • Some items released over next 3 years, but no full test release until 2014 • Reporting categories replacing objectives
STAAR v. TAKS • Increased rigor and depth • Greater number of more difficult items • Greater level of cognitive complexity • Rigor validated against nationally-normed exams and reviewed every 3 years • Increased number of items • Higher performance standards • Increased number of gridable items in math and science • Process skills embedded in Math, Sci, Soc St
State of Texas Assessments of Academic Readiness (STAAR) • Increased focus, clarity, depth • Changes in assessed curriculum Supporting standards Readiness standards Standards not assessed
Vertical alignment ofreadiness standards College and career readiness Alg II Geom Alg I Eng III Readiness for success at the next level Gr 8 Eng II Gr 7 Eng I Gr 6 Gr 8 Gr 5 Gr 7 Gr 4 Gr 6 Gr 3 Gr 5 Gr 4 Gr 3
STAAR and the TEKS Readiness Standards Supporting Standards 30% 35% 70% 65% Supporting Standards Readiness Standards
Assessed curriculum www.tea.state.tx.us/student.assessment/staar
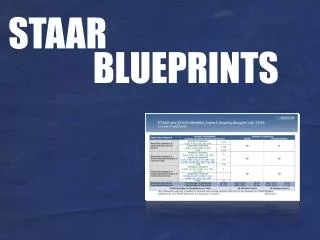
Blueprints www.tea.state.tx.us/student.assessment/staar
Readiness standards alignment http://lead4ward.com/resources/
No minimum score (e.g. 2) required on composition for satisfactory performance
The challenge ahead • Increasing accountability standards • New accountability indicators • Increased assessment rigor
What can we do now? • Look at TAKS commended performance as indicator of success with STAAR • Download Assessed Curriculum and Blueprint documents • Get to know readiness standards • How and when are these taught in your grade level? • How are they aligned vertically before and after your grade level?
Desired outcomes • Increase understanding of changes to the state accountability system for 2011 and beyond • Raise level of awareness of changes to the state assessment system for 2012 and beyond • Consider steps to address these changes