Download
1 / 5
50 likes | 146 Views
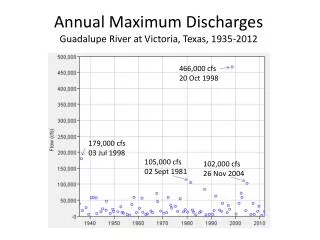
Explore the annual maximum discharges of the Guadalupe River at Victoria, Texas from 1935 to 2012, covering frequency analysis for both the periods of 1935-1978 and 1935-2012. Compare statistical parameters like mean, standard deviation, skewness, and design discharges for different return periods. Gain insights into the variations over the years and understand the comparative analysis between the two time frames.

E N D
Annual Maximum Discharges Guadalupe River at Victoria, Texas, 1935-2012 466,000 cfs 20 Oct 1998 179,000 cfs 03 Jul 1998 105,000 cfs 02 Sept 1981 102,000 cfs 26 Nov 2004
Comparison of Two Analyses • 1935-1978 (44 years) • Mean 4.278 • StdDev 0.404 • Skew -0.085 • Design discharges • 10 yr 61,929 cfs • 100 yr 155,880 cfs • 500 yr 250,962 cfs • 1935-2012 (78 years) • Mean 4.268 • StdDev 0.457 • Skew 0.188 • Design discharges • 10 yr 72,760 cfs • 100 yr 247,472 cfs • 500 yr 487,051 cfs
Comparison of Design DischargesGuadalupe River at Victoria, Texas 1935-2012 (78 years) 1935-1978 (44 years)