Download

1 / 1
10 likes | 97 Views
This study conducts a systematic search for X-ray cavities in galaxy clusters, groups, and elliptical galaxies to investigate AGN feedback phenomena. Using Chandra archive data, 124 cavities were detected from 56% of the total targets, providing insights into galaxy-SMBH co-evolution. The study presents results on cavity properties and environmental effects in a large sample, covering a broad dynamical range. Morphological links with radio emission suggest X-ray cavities originate from radio jets, offering clues into AGN feedback and galaxy-SMBH interactions. Analysis reveals correlations between cavity properties, major/minor axes, and distances within the observed targets. By studying X-ray cavities in various environments, this research aims to contribute to a better understanding of AGN feedback mechanisms.

E N D
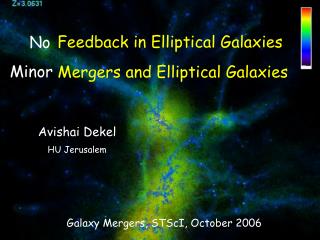
A systematic search for X-ray cavities in galaxy clusters, groups, and elliptical galaxies Jaejin Shin1,2, Jong-Hak Woo1,2, John S. Mulchaey2 1Seoul National University, Seoul, Republic of Korea 2Carnegie Observatories, Pasadena, CA, United States [O III] λ5007 • Abstract • Results AGN feedback is considered one of the most important phenomena for solving the "cooling flow" problem and driving the galaxy-SMBH co-evolution. As some of the strongest evidence for AGN feedback, X-ray cavities are useful for investigating AGN feedback over 10 kpc scales. Furthermore, X-ray cavities are believed to be connected with radio outbursts from AGN. By collecting all available X-ray data from the Chandra archive, we build up a sample of ~200 targets, including galaxy clusters, galaxy groups, and elliptical galaxies, in order to conduct a comprehensive study of X-ray cavities in various environments. Using modeling and unsharp masking techniques, we investigate the presence of X-ray cavities and their physical properties (i.e., cavity size) for the 89 targets with enough X-ray photons to perform the analysis. Here, we present our first results on the X-ray cavity properties and discuss environmental effects. Cavity detection Through beta modeling and the unsharpmasking method, we detected 124 cavities from 49 (56%) targets of our 87 targets. The other 38 targets show little evidence of cavities or cold fronts. Since the gas distribution of targets showing cold fronts are asymmetric (Fig 3), we did not consider these features as cavities. Abell 1991 Figure 3. Fitting result of Abell 1991. Smoothed raw image (left), smoothed beta model subtracted image (center), and unsharp masked image (right). Green ellipse represents fake cavity. Larger distance, larger cavity size Cavity properties (Major axis a, Minor axis b, distance between x-ray center and cavity center, and area of cavity) are strongly correlated. The minor axis-major axis relation and distance-major relation are similartoprevious results (Birzan et al. 2004, Dong et al. 2010). • Introduction • The result ofAGN feedback, x-ray cavities cover the larger scales (up to ~100kpc) compared to other feedback phenomena (i.e., AGN outflow). • Showing morphological links with radioemission, X-ray cavities likely originate fromradio jets. • Studying x-ray cavities can provide clues into galaxy-SMBH co-evolution. • However, previous study focused on narrow dynamical range with small sample. • Here, we investigate x-ray cavitiesin a statistically large sample with a large dynamical range. Log Area (kpc^2) Log major axis b (kpc) Log major axis b (kpc) Log minor axis b (kpc) Log Distance D (kpc) Log Distance D (kpc) Figure.1 The composite image of Hydra A cluster. X-ray data from Chandra (blue), Radio data from VLA (pink), and optical data (yellow) from CFHT. This composite image is taken from chandra.harvard.edu. Figure 4. Comparison between cavity properties. Major axis a- minor axis b relation (left), Major axis a-distance relation (center), and Area of cavity- distance relation (right). Color represents temperature. Dashed line (Birzan et al. 2004) and dotted line (Dong et al. 2010) show previous results. Higher temperature systems show larger cavities • Sample Log gas temperature (kev) Spatial resolution limit The largest sample size with the broadest dynamical range 1. High temperature systems tend to be observed at higher redshift (Fig 5a). Due to spatial resolution limitations, we can not detect small cavities at high redshift (Fig 5b). 2. Lower temperature systems have smaller x-ray gas distributions. Therefore, we cannot observe large cavities in low temperature systems. Log Redshift (z) To study x-ray cavity statistically, we retrieved archival data from the Chandra archive. We obtained our initial sample from the Cluster of galaxies (1522), Normal galaxies (978), and Active galaxies and Quasars (2452) categories. By visual inspection, we excluded targets which are point sources, have low S/N data, or showmerging features, and finalized 87 targets (Cluster of galaxies :78, Normal galaxies: 8, and Active galaxies and Quasars :1). Our sample is the largest (87) to date for studying cavities and covers the large mass range from individual galaxies to galaxy clusters. Log gas temperature (kev) Figure 5a. Comparisons between redshift and gas temperature. Growth limit Log Area (kpc^2) Log Area (kpc^2) Log Redshift (z) Figure 5. Comparisons between area of cavity and gas temperature. RXJ1532.9+3021 Figure 5b. Comparisons between redshift and area of cavity. Solid curve represents 1’’ circle area size as a function of redshift. • Analysis Beta modeling and Unsharp masking • Summary We detected cavities using beta modeling and unsharp masking method in CIAO. Mainly we used the beta model subtracted image to detect cavities and obtained a hint from unsharp masked image. For 16 targets, wemeasure cavity properties from theraw image because the model fits were not good. Cavity size and distance from x-ray centerweredetermined by visual inspection. • Out of ~5000 archivalobservations, we constructed a large sample of 87 targets with broad dynamical range and good S/N. • We detected 124 cavities from 49 targets using raw images or beta model subtracted images. • We found that the cavity size is larger when the cavity is farther from the x-ray center. • The observed temperature-cavity properties relation is due to the observational limit and intrinsicsize of the X-ray emission. • Future plan • Investigating systematic difference between cavity detected targets and non-detected targets • Studying multi-cavities system • Comparingradio propertiesto cavity properties Figure 2. Beta modeling and Unsharp masking results. Smoothed raw image (left), beta model (left center), residual image (right center), unsharp masking (right). Cavities are shown as green ellipses. Measuring gas temperature • References To investigate environment effects on x-ray cavity, we determined the gas temperature within R2500.R2500was calculated using thetemperature-radius relation (Eq. 12 of Virklihnin et al. 2006) Birzan et al. 2004, ApJ, 607, 800 Dong et al. 2010, ApJ, 712, 883 C. C. Kirkpatrick et al. 2009, ApJ, 709, L69 Virklihninet al. 2006, ApJ, 640, 691 Equation 1. temperature-radius relation Contact : Jaejin Shin jjshin@astro.snu.ac.kr