Download
1 / 24
240 likes | 370 Views
New England Space Science Consortium Meeting, UNH, 10/24/2012. Spectroscopic observations of CMEs. Hui Tian Harvard-Smithsonian Center for Astrophysics. Collaborators: Scott W. McIntosh, Steve Tomczyk. Spectroscopic observations.

E N D
New England Space Science Consortium Meeting, UNH, 10/24/2012 Spectroscopic observations of CMEs HuiTian Harvard-Smithsonian Center for Astrophysics Collaborators: Scott W. McIntosh, Steve Tomczyk
Spectroscopic observations • Line profiles are broadened: thermal, non-thermal, instrumental • Doppler shifts due to motions along LOS • Intensity is a measure of the amount of emitting material • Asymmetry: additional emission component • Slit spectrograph • HINODE/EIS • Small FOV, low cadence • More spectral sampling • Narrow-band tunable filter instrument • CoMP • Large FOV, high cadence • Less spectral sampling
Strong high-speed outflows associated with CMEs • Line profiles in CMEs are characterized by two components • A nearly stationary background • A strong high-speed (~200 km/s) component representing emission of the ejecta • Calculate the real speed: v=Sqrt(vpos2+vlos2)=300 km/s
Density & Temperature diagnostics • Compared to the background • higher density in the ejecta • almost evenly distributed in Log T = 5.3-6.1 • Mass of the ejecta • CME loop: 2.5 × 10¹⁴g • EUV Jet: 5 × 10¹³g
Weak high-speed outflows from post-CME dimming regions • Two emission components • A nearly stationary background • A weak high-speed (~100 km/s) component representing outflows • Blue shift of 10-50 km/s and enhanced line width are caused at least partly by the superposition of the two components • SGF can not reflect the real physics, assuming everything is moving at a uniform speed • A small portion of the materials in the dimming region are flowing outward at a speed around 100 km/s
Density & Temperature diagnostics • Dimming is an effect of density decrease rather than temperature change • Dimming is mainly due to the escape of materials with a temperature of log T ~ 6.1
Mass loss in the dimming region • The estimated mass loss in the dimming region is about 20-60 % of the CME mass • A significant part of the CME material is coming from the region where dimming occurred subsequently • Calculate outflow density by assuming an equivalence • of the total mass supplied by the outflow and the mass loss in the corresponding dimming region
CoMP: Coronal Multi-channel Polarimeter • Locations • Mauna Loa Solar Observatory: almost daily observations since October 2010 • Spectral sampling: • Fe XIII 1074.7/1079.8 nm and He I 1083.0 nm • Images of each polarization state at 3 or 5 spectral positions • FOV: 1.05 to 1.4 Rsun • Spatial Resolution: 4.46”/pixel • Cadence: typically 30 s or 50 s Tomczyk et al. 2008, Sol. Phys.
Stokes I • Line intensity: amount of plasma • Velocity: plasma motion in LOS • Line width: unresolved plasma motion Tomczyk et al. 2007, Science
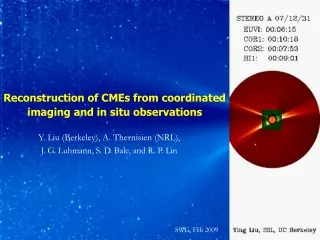
2011 Dec 07 CME • CMEs are usually associated with greatly increased Doppler shift and enhanced line width. The perturbation is much weaker in intensity. • The significant changes of Doppler shift are probably largely associated with the coronal response to the mass eruptions and lateral expansion of CMEs. • The increased line width might be caused by the enhanced flow inhomogenuity and turbulence in various substructures of CMEs in the LOS direction.
2012 May 26 CME • Partial halo CME: quickly-developed large-scale disturbance (EUV wave?) in the Doppler shift and line width (mainly at the west limb). • The perturbation in intensity is not as obvious as in Doppler shift and line width. • LASCO-C2 observed this CME 20 minutes later. CoMP observations might provide a cheap and low-risk means of space weather monitoring.
Conclusion • With spectroscopic observations, we can separate the pure ejecta emission from the background emission. Density, temperature, mass and LOS speed of the CME ejecta can be calculated based on UV spectroscopic observations • A small portion of the plasma in the dimming is flowing outward at a speed of ~100 km/s. These outflows should play an important role in the refilling of the corona and possibly mass supply to the solar wind • CoMP provides simultaneous high-cadence (30 s) observations of coronal line intensity, Doppler shift and line width, density, linear/circular polarization for the first time. These measurements might be useful to constrain models of CMEs • CMEs are associated with dramatic changes of Doppler shift and line width. Observations of halo-CMEs by CoMP-like instrument may provide a cheap and low-risk means of space weather monitoring References: Tian et al. 2012, ApJ, 748, 106 Tian et al. 2013, Sol. Phys., to be submitted Next: the IRIS Mission
Interface Region Imaging Spectrograph (IRIS) Slit spectrograph + Slit-jaw imaging (3 spectral ranges) (4 passbands) • Fast scans • (~5 s) • Super high spatial resolution • (1/3”) • CME emission and dynamics at Chromospheric and TR temperatures • Fine structures of CMEs FOV: 120”*175” for SG, 175”*175” for SJI
Spectroscopic observations of EUV jets • Two well-separated components • A nearly stationary background • A high-speed component (~160 km/s) representing the emission of the jet • Calculate the real speed: v=Sqrt(vpos2+vlos2)=223 km/s
Spectroscopic observations of coronal dimmings Attrill et al. 2010, Sol. Phys. McIntosh,ApJ, 2009 • ~20 km/s Blue shift: outflows refilling the corona • Enhanced line width: growth of wave amplitude
Immediately outside the (deepest) dimming regions • Our RB asymmetry analysis is able to detect them • Evaporation flows
Stokes Q, U, V • Circular Polarization (V): LOS magnetic field strength from longitudinal Zeeman effect • Linear Polarization (Q,U) from resonance scattering effect • Degree of linear polarization (Ltot/I) • Azimuth of B (POS magnetic field direction) Ltot=(Q2+U2)1/2 ϕ=0.5 atan (U/Q)
What IRIS can do • Joint observation with other instruments like HINODE/EIS • CME kinematics and plasma properties at a broad range of T • Flows and plasma diagnostics of flares • Waves triggered by CMEs & flares Red: IRIS lines Blue: EIS lines C II Ni II Fe II Fe XII Si IV Fe X Fe XIV Si VII O IV Fe XVI Fe VIII Fe XXI