Download
1 / 33
340 likes | 496 Views
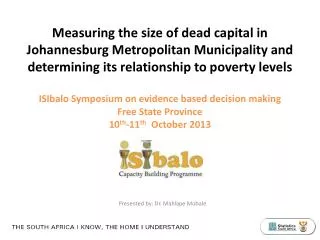
Measuring the size of dead capital in Johannesburg Metropolitan Municipality and determining its relationship to poverty levels ISIbalo Symposium on evidence based decision making Free State Province 10 th -11 th October 2013. Presented by: Dr. Mahlape Mohale. OUTLINE. Introduction

E N D
Measuring the size of dead capital in Johannesburg Metropolitan Municipality and determining its relationship to poverty levelsISIbalo Symposium on evidence based decision makingFree State Province 10th-11th October 2013 Presented by: Dr. Mahlape Mohale
OUTLINE • Introduction • Methods • Approaches to property markets valuation • The City of Johannesburg in brief • Results • Analysis • Challenges in measuring dead capital in the CoJ • Conclusion
1. Introduction Majority of the people in the world live in very poor conditions yet there are enough resources to support all the people on this planet. The world's poor control a vast storehouse of assets and resources, which combined with their proven entrepreneurial spirit, can be unleashed to enter the prosperous mainstream economy and eradicate poverty (de Soto, 2001). The burden of poverty in developing countries along with the imbalances between demand and supply of houses in urban areas has forced the urban poor to devise their own survival strategies and determine their own spaces in cities. By so doing the urban poor redefined urban space uses and became important role players in the property market that no government in developing countries can ignore (UNHABITAT, 2003).
1. Introduction Cont. • What is dead capital? De Soto (2000) defines “dead capital” as assets that cannot be used effectively for economic transactions, guarantees, contributions or compensation. • Why the concern about dead capital? • Informal dwellings in urban areas regardless of their low quality are economic goods that have market value • They serve large population estimated to be 1billion world- wide • Important indicator of inequality in society • Residential markets drive wealth generation in a country (UN-HABITAT, 2009) • Hence measuring the size of dead capital in urban areas and determining its relationship to poverty levels in order to devise strategies to convert it into life capital is necessary.
1. Introduction Cont. • de Soto introduced the “dead capital” debate in 1980s • Ddeveloping countries hold vast amounts assets • Poverty the result of the inability of actors in the informal economy to optimally utilise capital goods • Contributing factors include: • Dysfunctional property and financial markets and information asymmetry • Inability of the state to efficiently and cost-effectively establish property rights • Dead capital is generally linked to informal housing and business • Will enable people in the informal sector to enter the formal economy • Will mobilise dead capital and provide security of tenure • Will bring about market-led land reform and the provision of basic services • Proponents and opponents of dead capital concept • Reinforce inequitable land ownership • financial exploitation of new property owners • Loss of traditional, ingrained forms of tenure • Benefits only a few • de Soto’s central argument remains uncontested
1. Introduction cont. • International experience Latin America Revolution Africa ? Western World Japan & China Leveraging land resources for development (de Soto, 2001) “The Western World successfully revolutionized their legal systems, property laws, and developed the modern corporation that led to high living standards” “Japan and China instituted private property laws and business reforms resulting in economic development and growth of the middle classes” “ Assets in the hands of the poor in Europe, Latin America and Asia are estimated to be about US$9trillion” “Africa has a large and rapidly growing informal residential property market” however there is very little literature on informal residential market in Africa and SA in particular. The demand for an inclusive economic participation by the poor is a global phenomenon
1. Introduction Cont. • The City of Johannesburg (CoJ) Three developmental states of residential market in the CoJ where the assets exist in many forms: Stage 1: DEAD CAPITAL Housing assets that are only used for shelter Stage 2: HYBRID (DORMANT/SLEEPING) CAPITAL Housing assets that are used for shelter and to supplement income for subsistence. The income derived from rentals is used to support the households and keep them just above the poverty line. Stage 3: LIVE CAPITAL When housing assets are used for other purposes beyond shelter and subsistence, such as financing enterprise development. The sources of credit for this come from both formal and informal financial sectors.
Formal residential houses – Soweto Figure 1: Types of housing settlements in CoJ The changing face of black residential market in CoJ
Figure 2: Residential flats in the CBD – Hybrid residential market Mixed use flat, Low income group flat and gentrified flats in Hillbrow
Figure 3: Types of housing settlements in CoJ Alexandra near Sandton City Johannesburg How do the poor respond to the urban environments
2. Methods 2.1 Study area: Black residential areas in the City of Johannesburg (Black & Coloured) 2.2 Sources of data a) Secondary: The CoJ Valuation Register Roll update 2004 Stats SA -Censuses, LCS, IES and Poverty Measurement b) Primary data – 1100 DU from 33 sub-place names 2.3 Analysis Qualitative and quantitative methods
Figure 5: City of Johannesburg - Settlement types Source: Stats SA, Census 2011 results 2012
Figure 6: The location of black residential areas in the CoJ relative to the CBD
3. Approaches to property markets valuation Different methods for formal and informal property valuation • USA -uses the Cost, the Sales Comparison and the Income approaches. • The United Kingdom uses Comparative, Investment, Residual Profit and Cost methods • Germany according to Schulz (2002) Net Present Value (NPV) and Capitalization method • Other approaches especially in mass appraisals of homogeneous settlements are Automated Valuation Models (AVM) that uses statistical models such as multiple regression analysis or geographical information systems. AVM may not be appropriate for estimation of property values in informal settlements because they are heterogeneous in terms of plot sizes, dwelling unit sizes and construction material used. The formal market a) NPV is the ratio of benefit to cost, derived by subtracting costs from benefits in money terms. Usually used for capital investments and less so in real estate investments. Where: - C0 = Initial investment • C = Cash flow r = Discounted rate T = Time • Cost capitalization method uses a calculated rate to determine current value of property based on income. CR = expressed as a ratio or percentage where CR is cost capitalization rate sale price is the most recent sold price of a property Net income is rental income less expenses
3. Approaches to property markets valuation cont. c) Owner valuation method for informal property market & poverty estimates The Informal market valuation Steps in calculating dead capital i) Average CoJ Registrar Roll value (A) = • Average owner estimated value (B) = • Establish the extend of the difference between average value of property and average annual income (C) = (A)-(B) • Determine % difference (D) = (C)/(A) • Absolute value of differences (E) • Absolute value of differences as a % of mean Register value(F) = (E)/(A) • Pearson correlation coefficient • Sample size (N) for all settlement types Dead capital Q = E x the number of DUs Note Calculate the vale according to settlement type
4. The City of Johannesburg in brief • Biggest city in SA with 4 434 827people (37.5% of Gauteng) • Area = 1645km2 • Most densely populated city in SA at 2696people /Km2 (all) however for blacks the pop. density is 10 329people/km2 • Economic hub of South Africa contributing the biggest share of Gauteng’s 36.4% GDP • 130 wards of which 82 are mainly black residential areas Occupying 352km2 (20.4%) of the CoJ’s 1645km2 land mass. • Majority of black people resides >20km away from the CBD. Only a small percentage stay in CBD • 1 434 856 households - 1 173 562 in formal residential areas and 249 823 in the informal residential areas. • Blacks and coloured households make up 81.3% (1 166736) & the average household size is 3.18people • No. of DUs in formal backyards (90 587 formal structures & 122 869 Informal )
5. Results • Qualitative • CoJ a classical apartheid city • No transformation in settlement patterns in the CoJ. • Blacks still stay on the periphery of the city - poorly serviced areas in some parts. • Almost every former apartheid era house in Soweto has been upgraded • Mixed social classes coexist in harmony in black areas as illustrated below.
5. Results cont. Figure 7: Mixed social class housing in Soweto Upper middle class house Apartheid era house not upgraded but with a new perimeter wall Lower middle class house Entire street with middle class houses High income group house Apartheid era government houses in Mapetla SOWETO
5. Results cont. • Qualitative results • Legal framework - a mixture of both de juro and de facto • Political support for the urban poor is strong • Distance from the CBD residential areas are located > 20km form CBD • Settlement types- Formal and informal, single sex hostels and in the formal areas there is mixed social classes in all areas, informal houses in both formal and informal settlements • Characteristics of houses- Same size of stands, same valuation by CoJ regardless of upgrades and backyard structure • Economic activities • Income levels are low • Economic structure dominated by informal sector mainly trading in food staff and soft goods; property rentals; construction; services, metal works and transport (taxis) • Transport system • Environmental care • SOWETO is surrounded by mine dumps that release a lot of dust to residential – high prevalence of Asthma and respiratory diseases • Sporadic green parks and public gardens in the formal areas and none in the informal.
5. Results cont. • Quantitative results Figure 8: Settlement type by race in City of Johannesburg
Figure 9: Household tenure status for Blacks and coloureds Source: Census 2011 results
5. Quantitative results Table 1: Average valuations by settlement type Table 2: Summary statistics
5. Results cont. To estimate the value of dead capital in CoJ the absolute value of the difference (E) is multiplied by the number of households that are not participating in the formal property market. Let (R) be number of informal DUs = 124 675 (S) = 230 872 be the number of formal DUs that are Owned but not yet paid off (meaning they are bonded) and (T) = 470 433 be the number of formal households not participating in the formal property market less backyard DUs where the No. of formal DUs in the backyard = 90 587 and the no. of informal DUs backyard = 122 869 therefore T = 683889- 90 587- 122869 = 470 433 E1 = The absolute value of the difference for the formal houses and E2 = the absolute value for the informal houses (stands) Then The total number of DUs that form dead capital are (P) = (R) + (T) = 124 675 + 470 433 = 593 103 Where (q1) is the value for the formal housing (q1) = (E1) x (T), which is = R192 000 x 470 433 = R90.323trillion and (q2) is the value of the informal housing (q2) = (E2) x (R), which is = R6 000 x 124 675 = R0.748 billion Therefore (Q) The value of dead capital = (q!) + (q2) = R0.748billion + R90.323trillion = R91.071trillion
6. Analysis of Results • Black residential areas most compacted >10 000people /sq.km • High rental stock – rental market vibrant (44.3%) stay in rented DUs • There is security of tenure in black areas both de jure and de facto yet poverty levels remain high • Assets held by blacks are undervalued by authorities and the market • Participation of blacks in formal property market remain low (20%) • Information asymmetry is one of the factors contributing to market distortion • Informal housing - The property and rental values of the structures are underestimated by owners. Prices covered only construction material thus excluding labour cost, land, services provided. • Alexandra is a slum proximal to one of the most prime areas in the CoJ. With huge potential to be transformed into a high market residential area for blacks provided they do it for themselves.
7. Challenges in measuring dead capital in the CoJ • Gaps in literature • Lack of direct measurements of dead capital. • The form of SA cities - the legacy of apartheid and lack of transformation in land use. • Complexity of the informal residential sector and emerging global issues beyond. formalization- inclusivity, consultative, and participation in decision making . • The asymmetry of information. • Unavailability of data at small areas’ level. • The continuous flux of the informal sector.
8. Conclusion • Dead capital - storage of value and wealth for the poor in JHB, GP and SA • Poverty in CoJ is much lower than other parts of the country • The current economic model remains the main stumbling block in unlocking potential for HIDs to prosper • The Western world system’s failure to fully understand and recognise the operations of social systems and economic dynamics in the developing world has locked out of the main stream economy the value of assets that are in the hands of the poor. As de Soto (2001) puts it: • “extending the benefits of the market economy to those living in the informal world will require an understanding of the underlying causes of informality in order for nations to adopt comprehensive and inclusive policies” • From dead capital to live Capital Capitalizing the assets and resources that are in the hands of the poor can unshackle the urban poor from the chains of poverty.
8. Conclusion cont. • From dead capital to live capital • Formalization of tenure • Alternative legal system that combines the African land tenure system (traditional/customary law) with the Western world property law. • Institutional transformation • Social capital developmental approach to poverty reduction • Environmental protection for sustainable development. • Developing credit facilities for informal property market • What is the situation in the Free State? From dead capital to live Capital
Mangaung Metropolitan Municipality Source: N. ChobokoaneISIbalo presentation
Compactness Source: N. ChobokoaneISIbalo presentation
Density Source: N. ChobokoaneISIbalo presentation
References • De Soto, H. (2000) The Mystery of Capital: Why Capitalism Triumphs in the West and Fails Everywhere Else. 1st Ed. New York Books. Pp20-80. • http://digitalcommons.liberty.edu/gov_fac_pubs/173 Samson, S.A. (2004) HERNANDO DE SOTO: CITADELS OF DEAD CAPITAL, STUDY GUIDE, 2004. Accessed 08/07/2012. • http://digitalcommons.liberty.edu/gov_fac_pubs/173 Samson, S.A. (2004) HERNANDO DE SOTO: CITADELS OF DEAD CAPITAL, STUDY GUIDE, 2004. Accessed 08/07/2012. • UNHABITAT, Report 2/2012, Designing a land records system for the poor. • Rakodi, C (1992) Housing Markets in the Third World Cities: Research Policy into 1990s. World Development, Vol. 20. No. 1 pp 39-55. • Durand-Lasserve, A. and Selod, Harris (2007) The formalisation of urban land tenure in developing countries. World Bank’s 2007 Urban Research Symposium, May 14-16, Washington DC. • Statistics South Africa’s several releases: Census 2011, (2012) Measuring poverty in South Africa: Poverty lines for statistical reporting. Technical Report. November, 2008. Income and Expenditure of Households 2010/2011. (6 November, 2012) Living Conditions of Household in South Africa 2008/2009. (2011)