Download

1 / 19
200 likes | 372 Views
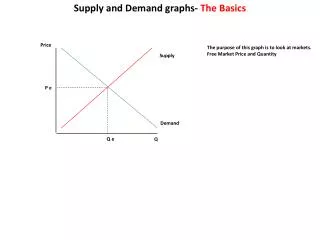
Supply and Deman d graphs- The Basics. Price. The purpose of this graph is to look at markets. Free Market Price and Quantity. Supply. P e. Demand. Q e. Q. The Aggregate Market- The Basics. Long Run Aggregate Supply (LRAS). Aggregate- all together (total). Price Level

E N D
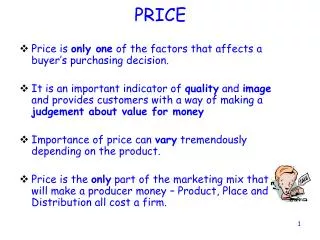
Supply and Demand graphs- The Basics Price The purpose of this graph is to look at markets. Free Market Price and Quantity Supply P e Demand Q e Q
The Aggregate Market- The Basics Long Run Aggregate Supply (LRAS) Aggregate- all together (total) Price Level Measure of Inflation Aggregate Supply (AS) The purpose of this graph is to look at countries. Total supply and demand at full employment P e AD= Aggregate Demand AD= GDP= C + I G + NX Aggregate Demand (AD) Q e G.D.P real employment Qy Qy= Quantity at full employment You may find it amazing how a fairly simple graph can be interpreted in so many different ways. Learning the basics of the graph will provide you an opportunity to learn fiscal and monetary policy in different ways. The law of demand is the same. There is an inverse relationship- PL up, AD down, PL down AD up The law of supply is the same There is a direct relationship- PL up, AS up, PL down AS down
Conflicting Views Keynesian Views Classical Views John M. Keynes More Government Micro not Macro Keynesians Neo-Keynesians Increase Gov’t Demand-siders spending Fiscal Policy F.A. Hayek Neo-Classical Austrian Monetarist Supply-siders Less Government Equilibrium of market Increase consumer or Investments 1. Prices and Wages are flexible – markets quickly and efficiently achieve equilibrium. When applied to the resource market full employment is maintained- unemployment is not a long term problem 1. Prices and Wages are Sticky- Prices and wages respond slowly to changes in supply and demand and this results in shortages and surplus- especially with labor. 2. Increase Aggregate Demand to increase GDP- is influenced by a host of economic decisions both public and private. 2. Say’s Law- supply creates it own demand- aggregate product of goods and service produces enough income to exactly purchase all output 3. “In the Long Run we are all dead”- care more about Short run and not so much about the long run. Changes in AD have greater short run effect on real GDP and employment but not as much on price. What is true in the short run isn’t always true in the long run Savings-investment equality-any decrease in output because of savings is offset an increase in the demand for investment This creates a different market – the money market Investment is demand Savings is Supply Interest rates create equilibrium- Monetarist 4. The multiplier- increases in spending will increase consumption and increase output- which will lead to more spending 5. Steer the Market- advocated stabilization policies such as tax, government spending, laws, and regulation in order to defend against the sudden and unpredictable changes in the business cycle
AS/AD/LRAS graphs- Classical vs Keynesian models Labor Market Wages (AS) W e W 1 (AD) (AD) 1 Q 1 Q Employment Q 2 Classical (Monetarist)- believe that when demand for employment decreases- wages will fall and the market will clear (return to equilibrium). Some people will choose not to work but most will eventually lower their wages. Keynesians- say- no when demand for employment falls- wages and prices are sticky. We simply get a new quantity at the same wage. This creates a surplus of supply of workers which will remain until demand increases. Quantity demanded is less than the quantity supplied.
Aggregate Supply (The classical model) The whole purpose of these graphs is to find the Price level, GDP, and unemployment AS is vertical and at the same point of full employment Classical economist believe that resources prices and wages are flexible This model says that the government doesn’t need to get involved because the market will fix itself. (AS) much like the LRAS P.L. P e What will happen to price as AD falls? P 1 The classical model suggest that the economy fixes itself and that prices and resources price will fall to create a new equilibrium. (AD) (AD) 1 Q y G.D.P real When Aggregate demand falls what happens to. . . Price? Employment? Wage (remember wages are price)? GDP real?
Aggregate Supply (The classical model) If there is a decrease in AD There will be a reduction in price level and higher unemployment LRAS P.L. SRAS According to classical economist the SRAS will eventually increase as wages decrease and the price of resources decrease This will give you a new quantity demanded back at full employment SRAS 1 P e P 1 (AD) (AD) 1 This will occur as long as wages can adjust. What can keep wages artificially elevated? Or in other words what can keep the market from clearing? Q 1 Q y G.D.P real Q 2 Whether or not the market will clear will also depend on the worker’s wage expectations. Unions Rational Expectations Workers will revise their expectations instantaneously Adapted Expectations It may take workers weeks, months, or years but eventually they will adapt their wage expectations. Min. Wage laws Unemployment benefits
Aggregate Supply (The Keynesian Model) LRAS P.L. P e (AD) 1 (AD) Q y full Y1 G.D.P real According to Keynes, it is possible for the economy to be in a recession permanently. Prices/wages won’t change and output will remain low. When output is below full employment, the price level doesn’t fall because wages/resource prices don’t fall (wages are sticky)
Aggregate Supply (The Keynesian Model) LRAS P.L. P e (AD) 1 (AD) 2 (AD) 3 (AD) 4 (AD) 5 Q y full Y1 G.D.P real According to Keynes, only with the help of the help of the government can Aggregate demand increase. Demand side economics- focus on demand Fiscal approach- government spending and taxation Monetarist approach is to increase investments Any aid past Qy- is purely inflationary
Aggregate Supply – So what Model is correct? They Both have some valid points LRAS P.L. Classical Phase When in the Classical Phase The economy is operating at full employment Any and all increase in AD will result in an increase in price and in increase in inflation P e Intermediate Phase Keynesian Phase AD AD AD Q y full G.D.P real When in the Intermediate Phase As AD approaches the curve An increase in AD and decrease in unemployment Result in a gradual increase of price and some inflationary pressure When in the Keynesian Phase Output can increase with no change in price. No increase in price level, no inflationary pressure, spare room to grow.
AS/AD/LRAS graphs- how it works during Expansion If Aggregate Demand increases (LRAS) (AS) 1 P.L. Both Prices and GDP will increase. (AS) C P 2 In the long run – an increase in price will not lead to an increase in output. Why? P 1 B A P e Because as prices increase so does the price of resources including labor, wages, and materials. (AD) 1 (AD) Q e Q 1 G.D.P real As a result the Aggregate supply will shift to the left (decrease) and we will find ourselves back at full employment. Qy
AS/AD/LRAS graphs- how it works during Recession If Aggregate Demand decreases. (LRAS) P.L. (AS) Both Price Level and output will decrease. (AS 1) In the long-run a decrease in price will not lead to a decrease in output. Why? A P e B P 1 Because as prices decrease so does the price of resources including labor, wages, and materials. C P 2 (AD) (AD) 1 Q e G.D.P real Q 1 As a result the Aggregate supply will shift to the right (increase) and we will find ourselves back at full employment. Qy
Inflationary and Recessionary Gaps- Steering the Market Potential GDP Economic Activity Inflationary Gap Recessionary Gap Time (years) The Government can steer the economy in different ways Laws and Regulations- stabilizers Fiscal Policy- changes in government spending or taxation to influence the economy Monetary policy- changes in monetary supply to influence the economy
AS/AD/LRAS graphs- Inflationary Gap Actual GDP > Potential GDP Output is beyond full employment Price Level LRAS AS Unemployment very low Prices very high Government wants to limit inflation by reducing demand P1 How do they do it? P2 AD 1 AD 2 GDP real Q y FE Q1 Gov’t can decrease gov’t spending or increase tax on consumers. AD = C + I + G + NE Federal Reserve can decrease money supply or increase interest rates. AD = C + I + G + NE Fiscal Policy: Monetary Policy:
AS/AD/LRAS graphs- Recessionary Gap Actual GDP < Potential GDP Output is below full employment Price Level LRAS High unemployment AS Government wants to limit unemployment by increasing demand P2 P1 How do they do it? AD 2 AD 1 GDP real Q y FE Q1 Gov’t can increase gov’t spending or decrease tax on consumers. AD = C + I + G + NE Federal Reserve can increase money supply or decrease interest rates. AD = C + I + G + NE Fiscal Policy: Monetary Policy:
Supply-side theory in AS/AD/LRAS LRAS 1 LRAS 2 LRAS 3 v v v Supply side economics Supports any action by the government that enables business to lower cost, boost efficiency, and competitiveness. This increases potential output 3. There are a number of methods Increase labor market flexibility- Lower min. wage, Weaken trade unions, Reduce unemployment benefits Invest in education Lower income tax and capital gains tax- eliminate progressive tax (marginal tax rates) Lower corporate tax rates Invest in infrastructure 4. Eliminate safety nets and allow for profit and loss
http://econstories.tv/ http://www.econedlink.org/lessons/index.php?lid=593&type=educator