Download
1 / 30
310 likes | 475 Views
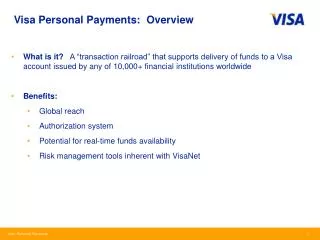
Commercial Payments Overview Visa, Inc. NAEP April 2012. Agenda. Commercial Payments VisaNet Commercial Payments Industry Trends Payables Automation Economic Factors RPMG Review. 2. VisaNet. 16,600 Financial Institutions.

E N D
Agenda Commercial Payments VisaNet Commercial Payments Industry Trends Payables Automation Economic Factors RPMG Review 2
VisaNet 16,600 Financial Institutions 64 Billion TransactionsIncludes payments and cash transactions 1.8 Billion Cards Acquirers Issuers Merchant Processors Card Processors 30 Million Merchant Outlets* $2.7 Trillion in Payments Volume $4.6 Trillion in Total Volume Merchants Cardholders Note: Data for four quarters ended June 30, 2009Source: Visa Inc. for four quarters ended June 30, 2009* As reported by client financial institutions and therefore may be subject to change; includes merchant outlets in Visa Europe territory 3
US Commercial Opportunity US Commercial Opportunity is estimated at $18.7T in 2010 and is forecast to grow at a CAGR of 6.2% during the next 5 years $USD Trillions Forecast 5 Year CAGR: 6.2% Source: Visa Commercial Consumption Expenditure Index; Economist Intelligence Unit (EIU) modeling and analysis, September 2011. Results include retail and wholesale intermediate inputs and prior year results reflect revisions in published government data. 2010 results are estimates only - government sources typically publish actuals within two years of estimates. CCE Forecast by EIU 6
Payables Automation Trends Purchasing Card Spending in North America (in $ billions) Source: RPMG 2010 Purchasing Card Benchmark Survey Results. (This data does not reflect any forecast, prediction or expectation regarding Visa’s performance or revenues.) Sustained electronic B2B payments growth is being driven by organizations seeking the achieve great cost savings with traditionally inefficient functions. 7
Payables Automation Adoption Source: Practical Guide to Accounts Payable Automation, Visa PerformSource 2010. 8
Global Large/Middle Market Trends Global Commercial Payment Card Purchase Volume by Type 2005 - 2014 Large and Middle Market Trends $Billion USD • Cash/treasury management top of mindgiven recent economy; companies focused on tools that provide spend visibility and control • Automating the accounts payable processcontinues to gain momentum, driving deeper penetration of B2B spend • Middle market companies are receiving increased attentionfrom many issuers given comparative profit dynamics • Companies increasingly operating globallyand issuers partnering to serve them at an accelerating pace • Public sector drives adoption of payment products and solutions Source: Packaged Facts, December 2009 9
Payment Strategies Buying Organization Payment Type Decision Factors Source: NAPCP / First Annapolis, “End-User Perspective on Suppliers’ Acceptance of Card Payments,” June 2010 (n=146). Question: How often does your organization consider the following factors when determining how to pay a supplier willing to take any form of payment? 11
Transaction Cost Source: Aberdeen Group Analysis May 2010. Cited in “E-Payables 2010: The Strategic Value of Accounts Payable Automation” Aberdeen Group August 2010. 12
Payment Strategies • Supplier Types: • Strategic • Catalog • Direct • Indirect • Large Ticket • Small Ticket • On-Going • One-Time Change in Use of Electronic Payments In the context of these considerations, ACH and purchasing cards have been increasing while check payments have declined. Source: PayStream Advisors, “Electronic Payments: Streamline P2P, Reduce Costs,” Q2 2010. 13
Payment Strategies Traditional Checks • Most common form of B2B payments, but highest cost to process • Suppliers will often permit 45 – 60 day payment terms • Check payments take 3 – 5 days to settle, increasing a supplier’s DSOs Wire Transfers • Generally offer same day settlement for the buyer and supplier • High transaction fees to send and receive • Typically reserved for large dollar or international transactions, since for smaller, reoccurring transaction the high cost can be prohibitive ACH (Automated Clearing House) • Utilizes an electronic network via a daily batch process with a 1 – 2 day settlement delay • Standardized payment files with limited remittance information • Can be easily integrated into AP systems Conventional / Traditional Use of P-Cards • Most widely used card payment product for procurement of goods by various channels • Can replace the traditional PO / invoice / approval process • May have embedded controls to ensure compliance Source: First Annapolis primary research as of April, 2010. 14
Purchasing Card Spending Source: RPMG Purchasing Card Benchmark Survey 2010 20
Average Growth Rates Source: RPMG Purchasing Card Benchmark Survey 2010 21
Type of Change in Spending Source: RPMG Purchasing Card Benchmark Survey 2010 22
Average Growth Rates Source: RPMG Purchasing Card Benchmark Survey 2010 23
Type of Change Expected Source: RPMG Purchasing Card Benchmark Survey 2010 24
Expected Growth Rates Source: RPMG Purchasing Card Benchmark Survey 2010 25
Type of Change Expected Source: RPMG Purchasing Card Benchmark Survey 2010 26
Expected Growth Rates Source: RPMG Purchasing Card Benchmark Survey 2010 27
Payment for All Under $2,500 Source: RPMG Purchasing Card Benchmark Survey 2010 28
Payment for All ($2,500 - $10,000) Source: RPMG Purchasing Card Benchmark Survey 2010 29