Download
1 / 1
20 likes | 182 Views
An Investigation of Factors that Affect the Mass Range of Atmospheric Pressure Laser-Induced Acoustic Desorption Chemical Ionization (AP/LIAD-CI) vs. AP/LIAD-Electrospray Ionization Mass Spectrometry. Yer Yang, 1 Leonard Nyadong, 2 Ryan P. Rodgers, 2, 3 Alan G. Marshall. 2, 3

E N D
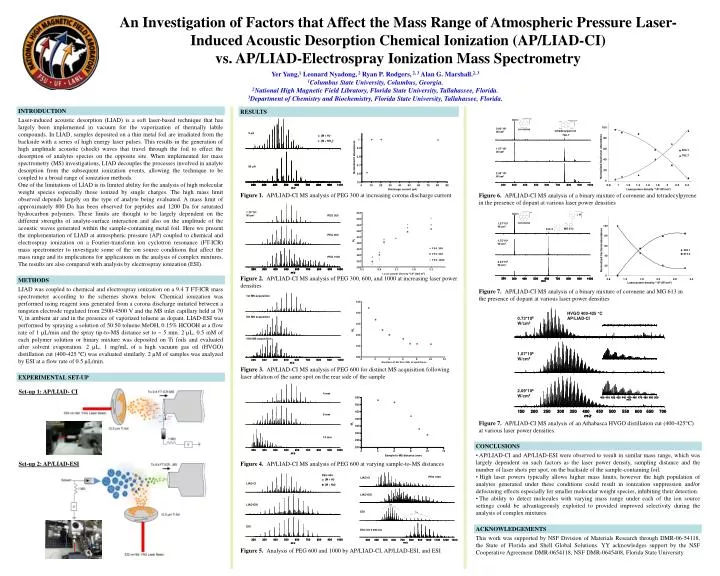
An Investigation of Factors that Affect the Mass Range of Atmospheric Pressure Laser-Induced Acoustic Desorption Chemical Ionization (AP/LIAD-CI) vs. AP/LIAD-Electrospray Ionization Mass Spectrometry Yer Yang,1 Leonard Nyadong, 2 Ryan P. Rodgers, 2, 3 Alan G. Marshall.2, 3 1Columbus State University, Columbus, Georgia. 2National High Magnetic Field Libratory, Florida State University, Tallahassee, Florida. 3Department of Chemistry and Biochemistry, Florida State University, Tallahassee, Florida. Figure 1. AP/LIAD-CI MS analysis of PEG 300 at increasing corona discharge current Figure 6. AP/LIAD-CI MS analysis of a binary mixture of coronene and tetradecylpyrene in the presence of dopant at various laser power densities Figure 2. AP/LIAD-CI MS analysis of PEG 300, 600, and 1000 at increasing laser power densities Figure 7. AP/LIAD-CI MS analysis of a binary mixture of coronene and MG 613 in the presence of dopant at various laser power densities Figure 3. AP/LIAD-CI MS analysis of PEG 600 for distinct MS acquisition following laser ablation of the same spot on the rear side of the sample Set-up 1: AP/LIAD- CI Figure 7. AP/LIAD-CI MS analysis of an Athabasca HVGO distillation cut (400-425°C) at various laser power densities. Set-up 2: AP/LIAD-ESI Figure 4. AP/LIAD-CI MS analysis of PEG 600 at varying sample-to-MS distances Figure 5. Analysis of PEG 600 and 1000 by AP/LIAD-CI, AP/LIAD-ESI, and ESI