Download

1 / 39
390 likes | 423 Views
Explore supply in economics, market equilibrium changes, supply curve shifts, and factors affecting supply with real-world examples and practical applications. Learn how price, technology, and related goods impact sellers' decisions.

E N D
Lecture 7: Examining Supply and Market Price Determination • Supply • Price Determination • Changes in Market Equilibrium • Examples • Work for the weekend • Review Lab Times
Supply • If a firm supplies a good or service, the firm • Has the resources and technology to produce it, • Can profit from producing it, and • Has made a definite plan to produce it and sell it.
Supply • The quantity supplied of a good or service is the amount that producers plan to sell during a given time period at a particular price.
Supply • What determines selling plans? • The price of the good • The prices of resources used to produce the good • Technology • The number of suppliers • The prices of related goods produced • Expected future prices
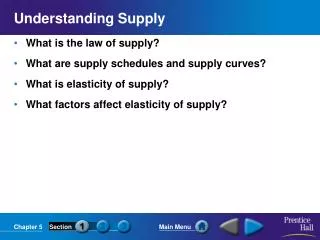
Supply • The Law of Supply • Other things remaining the same, the higher the price of a good, the greater is the quantity supplied.
Supply • Supply Curve and Supply Schedule • Supply curves show the relationship between the quantity supplied of a good and its price (ceteris paribus). • Supply schedules list the quantities supplied at each different price (ceteris paribus).
Supply Price Quantity (dollars per tape) (millions of tapes per week) a 1 0 b 2 3 c 3 4 d 4 5 e 5 6
Supply 6 5 Price (dollar per tape) 4 3 2 1 0 2 4 6 8 10 Quantity (millions of tapes per week)
Supply 6 5 Price (dollar per tape) e 4 d 3 c 2 b 1 a 0 2 4 6 8 10 Quantity (millions of tapes per week)
Supply 6 Supply of Tapes 5 Price (dollar per tape) e 4 d 3 c 2 b 1 a 0 2 4 6 8 10 Quantity (millions of tapes per week)
Supply • A Change in Supply • When any factor that influences selling plans other than the price of the good changes, there is a change in supply. • An increase in supply causes the supply to shift rightward. • A decrease in supply causes the supply curve to shift leftward.
A Change in Supply • Price of Productive Resources • Technology • The Number of Suppliers
A Change in Supply • Price of Related Goods Goods Produced • Substitutes in Production • Complements in Production • Expected Future Prices
Supply Original supply schedule Old technology Price Quantity (dollars (millions of tapes per tape) per week) a 1 0 b 2 3 c 3 4 d 4 5 e 5 6
Supply Original supply schedule New supply schedule Old technology New technology Price Quantity Price Quantity (dollars (millions of tapes (dollars (millions of tapes per tape) per week) per tape) per week) a 1 0 a' 1 b 2 3 b' 2 c 3 4 c' 3 d 4 5 d' 4 e 5 6 e' 5
Supply Original supply schedule New supply schedule Old technology New technology Price Quantity Price Quantity (dollars (millions of tapes (dollars (millions of tapes per tape) per week) per tape) per week) a 1 0 a' 1 3 b 2 3 b' 2 6 c 3 4 c' 3 8 d 4 5 d' 4 10 e 5 6 e' 5 12
Supply Supply of tapes (old technology) 6 5 e Price (dollar per tape) 4 d 3 c 2 b 1 a 0 2 4 6 8 10 12 14 Quantity (millions of tapes per week)
Supply Supply of tapes (new technology) Supply of tapes (old technology) 6 5 e e' Price (dollar per tape) 4 d d' 3 c c' 2 b b' 1 a a' 0 2 4 6 8 10 12 14 Quantity (millions of tapes per week)
The Supply of Tapes • The Law of Supply • The quantity of tapes supplied • Decreases if: • The price of a tape falls • Increases if: • The price of a tape rises
The Supply of Tapes • Changes In Supply • The supply of tapes • Decreases if: • The price of a resource used to produce tapes rises • The number of tape producers decreases • The price of a substitute in production rises • The price of a complement in production falls • The price of a tape is expected to rise in the future
The Supply of Tapes • Changes In Supply • The supply of tapes • Increases if: • The price of a resource used to produce tapes falls • More efficient technologies for producing tapes are discovered • The number of tape producers increases • The price of a substitute in production falls • The price of a complement in production rises • The price of a tape is expected to fall in the future
A Change in the Quantity Supplied Versus a Change in Supply • A movement along a supply curve, which results from a change in price, shows a change in the quantity supplied. • If some other influence on sellers’ plans changes, holding price constant, there is a change in supply.
A Change in the Quantity Supplied Versus a Change in Supply S0 Price Quantity
A Change in the Quantity Supplied Versus a Change in Supply Increase in quantity supplied S0 Price Decrease in quantity supplied Quantity
A Change in the Quantity Supplied Versus a Change in Supply S0 Price P0 Quantity Q0
A Change in the Quantity Supplied Versus a Change in Supply S0 Price P1 P0 Quantity Q0 Q1
A Change in the Quantity Supplied Versus a Change in Supply S0 Price P1 P0 P2 Quantity Q2 Q0 Q1
A Change in the Quantity Supplied Versus a Change in Supply S0 S1 Price Increase in supply Quantity
A Change in the Quantity Supplied Versus a Change in Supply S2 S0 S1 Price Decrease in Increase in supply supply Quantity
A Change in the Quantity Supplied Versus a Change in Supply Increase in quantity supplied S2 S0 S0 S1 Price Decrease in Increase in supply supply Decrease in quantity supplied Quantity
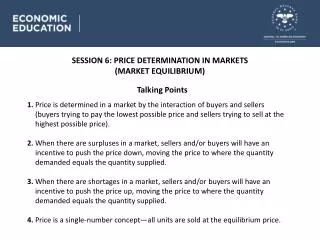
Market Equilibrium • Equilibrium in a market occurs when the price balances the plans of buyers and sellers. • Equilibrium price is the price at which quantity demanded equals quantity supplied. • Equilibrium quantity is the quantity bought and sold at the equilibrium price.
Market Equilibrium • Price as a Regulator • If the price is too low, quantity demanded exceeds quantity supplied. • If the price is too high, quantity supplied exceeds quantity demanded.
Market Equilibrium Quantity Quantity Shortage(–) Pricedemanded supplied or surplus(+) (dollars per tape)(millions of tapes per week) 1 9 0 2 6 3 3 4 4 4 3 5 5 2 6
Market Equilibrium Quantity Quantity Shortage(–) Pricedemanded supplied or surplus(+) (dollars per tape)(millions of tapes per week) 1 9 0 -9 2 6 3 -3 3 4 4 0 4 3 5 +2 5 2 6 +4
Market Equilibrium 6 5 Price (dollar per tape) 4 3 2 1 0 2 4 6 8 10 Quantity (millions of tapes per week)
Market Equilibrium 6 5 Price (dollar per tape) 4 3 2 Demand for tapes 1 0 2 4 6 8 10 Quantity (millions of tapes per week)
Market Equilibrium 6 Supply of Tapes 5 Price (dollar per tape) 4 3 2 Demand for tapes 1 0 2 4 6 8 10 Quantity (millions of tapes per week)
Market Equilibrium 6 Supply of Tapes 5 Price (dollar per tape) 4 3 2 Demand for tapes 1 0 2 4 6 8 10 Quantity (millions of tapes per week)
Market Equilibrium Surplus of 2 million tapes at $4 a tape 6 Supply of Tapes 5 Price (dollar per tape) 4 Equilibrium 3 2 Demand for tapes 1 Shortage of 3 million tapes at $2 a tape 0 2 4 6 8 10 Quantity (millions of tapes per week)