Download
1 / 1
10 likes | 119 Views
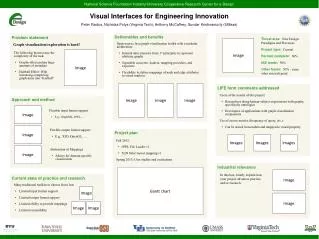
This project, funded by NSF and industry partners, aims to enhance graph visualization tools to support complex engineering design processes. The toolkit provides flexible input/output formats and efficient mappings for node and edge attributes, benefiting researchers and developers in creating innovative visual interfaces for engineering applications. The ongoing project is 66% complete, with deliverables such as an open-source Java graph-visualization toolkit and user studies in progress.

E N D
National Science Foundation Industry/University Cooperative Research Center for e-Design Visual Interfaces for Engineering Innovation Peter Radics, Nicholas Polys (Virginia Tech); Anthony McCaffrey, SundarKrishnamurty (UMass) Deliverables and benefits Problem statement Thrust area: New Design Paradigms and Processes Project type: Current Percent complete: 66% IAB funds: 50% Other funds: 50% - some other research grant Image • Open-source Java graph-visualization toolkit with a modular architecture • Internal data structure from 1st principles to represent arbitrary graphs • Separable concerns: loaders, mapping providers, and exporters • Flexibility to define mappings of node and edge attributes to visual markers Graph visualization/exploration is hard! Image • The following factors raise the complexity of the task: • Graphs often contain large amounts of metadata • Hairball Effect: With increasing complexity, graph turns into “hairball” Image Image Image LIFE form comments addressed • Users of the results of this project: • Researchers doing human-subject experiments with graphs, specifically ontologies • Developers of applications with graph-visualization components • Use of access metrics (frequency of query, etc.): • Can be stored in metadata and mapped to visual property Approach and method Image • Flexible input format support • E.g., GraphML, OWL, … Image • Flexible output format support • E.g., X3D, OpenGL, … Project plan Images Images Images • Fall 2012: • OWL File Loader v1 • X3D Solar layout mapping v1 • Spring 2013: User studies and evaluations Image • Abstraction of Mappings • Allows for domain-specific visualization Industrial relevance Gantt chart Image In this box, briefly explain how your project advances practice and/or research. Current state of practice and research • Many traditional toolkits to choose from, but: • Limited input format support • Limited output format support • Limited ability to provide mappings • Limited extensibility Image Image Image Image