Download
1 / 37
370 likes | 467 Views
8-10% of AP Exam. Research and Statistics in Psychology. Does sleeping less than seven hours a day reduce how long you will live? Do violent video games make people more aggressive? Can you make better decisions by not deliberating about them?

E N D
8-10% of AP Exam Research and Statistics in Psychology
Does sleeping less than seven hours a day reduce how long you will live? • Do violent video games make people more aggressive? • Can you make better decisions by not deliberating about them? • Can women judge men’s testosterone levels in just one glance? • Do IQ scores predict how long people will live? Why Research?
How should we go about investigating questions like these? • How do we find answers to our questions about behavior that are accurate and trustworthy? • Remember that psychology is empirical. • Psychologists are committed to addressing questions about behavior through formal, systematic observation. • This commitment to the empirical method is what makes psychology a scientific endeavor. Why Research?
Step One: Formulate a Testable Hypothesis • A hypothesis is a tentative statement about the relationship between two or more variables. • To be testable, hypotheses must be formulated precisely; the variables under study must be clearly defined. • Researchers achieve clear formulations by providing operational definitions of the relevant variables. • Operational definitions describe the actions or procedures used to measure or control a variable. • These operational definitions are essential for the replication (repeating) of concluded observations. • By replicating research, scientist are able to further prove or potentially disprove previous research results.
Step Two: Select Research Method and Design the Study • The 2nd step is to figure out how to put the hypothesis to an empirical test. • Method chosen depends in large degree on the nature of the question under study. • These various methods (experiments, case studies, surveys, naturalistic observations, etc.) have their advantages and disadvantages. • Researchers must weigh pros and cons of each. • Next, researchers must choose the participants for their study.
Step Three: Collect the Data Step Four: Analyze Data and Draw Conclusions • Observations made in a study are usually converted into numbers (raw data) to increase objectivity of the research. • Researchers then use statistics (descriptive and inferential) to analyze their data and decide whether their hypothesis has been supported. Step Five: Report Findings • Publication in Academic Journal • Studies replicated
An experiment is a research method in which the investigator manipulates a variable under carefully controlled conditions and whether any changes occur in a second variable as a result. • The purpose of an experiment is to find out whether changes in one variable (X) causes changes in another variable (Y). • To put it another way, how X affects Y. (Cause and Effect)
The (X) in this case would be the independent variable (IV). • An IV is the experimental factor being manipulated; the variable whose effect is being studied. • The (Y) in this case would be the dependent variable (DV). • The DV is the outcome factor; the variable that may change in response to manipulations of the IV.
In order to evaluate the effect of the IV on the DV, researchers study two separate distinct groups. • Experimental group: subjects who are exposed to the some version of the independent variable. • Control group: subjects who do not receive the special treatment given to the experimental group. Two Types of Groups
Placebo effect: when participants’ expectations lead them to experience some change even when they do not receive the IV • Confounding variables: any variable (other than the IV) that could affect the DV; usually variables that cannot easily be altered • Researcher Bias: when a researcher’s expectations or preferences about the outcome of a study can influence the results obtained Flaws in Experimentation
Because of inherent flaws in the experimentationprocess that could influence the results, researchers incorporate various methods to decrease the impact of those flaws. • Control variable: any element of an experiment that MUST NOT be changed or already be similar as these changes/differences could affect the outcome of that experiment (used to reduce alternative explanations) • Random assignment: assigning participants to experimental and control conditions by chance, minimizing the preexisting differences between the participants • Double-blind procedure: when both researcher and participants are unaware (“blind”) as to which group is the experimental and which is the control. Increasing Confidence
One factor distinguishes descriptive research methods from experimental research methods. • In descriptive research, experimenters CANNOT manipulate the variable under study. • These methods only permit investigators to describe patterns of behavior and discover links between variables. Looking for Links
In naturalistic observation a researcher engages in careful observation of behavior without intervening directly with the subjects. Jane Goodall conducted research on the social lives of chimps using naturalistic observation. Naturalistic Observation
A case study is an in-depth investigation of an individual subject. Anna O. Phineas Gage Henry Molaison Case Studies
A survey is a technique for ascertaining the self-reported attitudes or behaviors of people. • Surveys incorporate several steps to insure confidence in their results: • Most importantly they use random sampling in determining who participates in the survey. • Random sampling (similar to random assignment in experiments) ensure that each member of a population has an equal chance of inclusion. Surveys
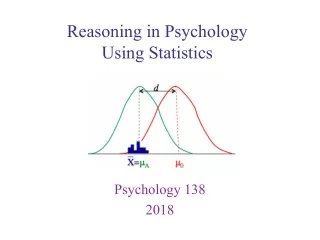
Whether researchers use experimental or descriptive methods, they need some way to make sense of their data. • Statistics is defined as the use of mathematics to organize, summarize and interpret numerical data. • Statistical analyses permit researcher to draw conclusions based on their observations. Statistics in Research
Descriptive statistics are used to organize and summarize data. Descriptive Statistics
In summarizing numerical data, researcher want to know what constitutes a typical or average score. • To answer these questions they use three measures of central tendency: median, mean and mode. • Median: score that falls exactly in the center of a distribution • Mean: arithmetic average of the scores in a distribution • Mode: the most frequent score in a distribution Central Tendency
In general, the mean is the most useful measure of central tendency. • However the mean is sensitive to extreme scores in a distribution, which can sometimes make the mean misleading. (Term defined as “skewed distribution”) A Note on the “Mean”
In describing a set of data, it is often useful to have some estimate of the variability among the scores. • Variability refers to how much the scores in a set vary from one another and from the mean. • The standard deviation is an index of the amount of variability in a set of data. • When variability is great, so too will be the standard deviation. • When variability is low, so too will be the standard deviation. Standard Deviation
A correlation exists when two variables are related to each other. • Researchers often want to quantify the strength of an association between two variables, so they depend on a descriptive statistic called the correlational coefficient. • The correlational coefficient is a numerical index of the degree of relationship between two variables. Correlation
Indicates direction of relationship (positive or negative) Correlation coefficient Indicates strength of relationship (0.00 to 1.00) r = + 0.37
A correlational coefficient indicates both: • (1) the direction of the relationship • (2) and how strongly the two variables are related. • A positive (+) correlation indicates that the two variables co-vary in the same direction. • Up and Up; Down and Down. • A negative (-) correlation indicates that the two variables co-vary in the opposite direction. • One up and one down. Direction of Correlation
The size of the coefficient indicates the strength of an association between two variables. • The coefficient can vary between -1.0 and +1.0. • A -1.0 indicates a perfect (one-to-one) negative correlation. • A +1.0 indicates a perfect (one-to-one) positive correlation. • A coefficient of zero (0) indicates no relationship exists at all. Strength of Correlation
THE MERE FACT THAT TWO VARIABLES ARE CORRELATED DOES NOT MEAN THAT THERE ALSO EXISTS A CAUSE AND EFFECT RELATIONSHIP.
A scatterplot is a graphed cluster of dots, each of which represents the values of two variables. • The slope of the points suggests the direction of the relationship (positive or negative). • The amount of “scatter” suggests the strength of the correlation. Perfect negative correlation (-1.00) Perfect positive correlation (+1.00) No relationship (0.00) Scatterplots
The Scatterplot below shows the relationship between height and temperament in people. There is a moderate positive correlation of +0.63.
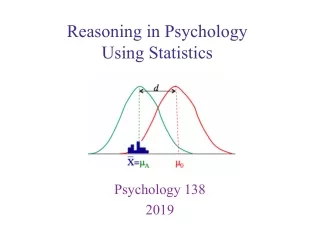
After researchers have summarized their data with descriptive statistics, they still need to decide whether their data support their hypotheses. • Inferential statistics are used to interpret data and draw conclusions. • Working with the laws of probability, researchers use inferential statistics to evaluate the possibility that their results might be due to the fluctuations of chance. Inferential Statistics
When statistical calculations (ones you don’t have to worry about for this class) indicate that research results are not likely due to chance, the results are said to be statistically significant. • Statistical significance is said to exist when the probability that the observed findings are to due chance is very low (usually about 5% chance). Statistical Significance