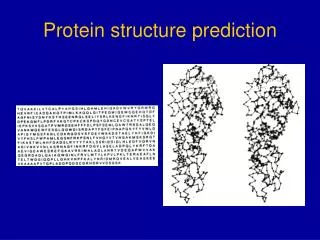
Protein structure prediction
250 likes | 427 Views
Protein data bank (PDB) : 46818 structures (oct 2007) SCOP (Structural Classification Of Proteins): • 971 folds (major structural similarity) • 1586 super-families (probable common evolutionary origin) • 3004 families (clear evolutionary relationship, ~ 30% identity).

Protein structure prediction
E N D
Presentation Transcript
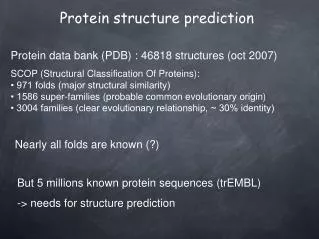
Protein data bank (PDB) : 46818 structures (oct 2007)SCOP (Structural Classification Of Proteins): • 971 folds (major structural similarity)• 1586 super-families (probable common evolutionary origin)• 3004 families (clear evolutionary relationship, ~ 30% identity) Protein structure prediction Nearly all folds are known (?) But 5 millions known protein sequences (trEMBL) -> needs for structure prediction
Usually, structure-activity relationships : site-directed mutagenesis, pharmacologic studies, drug design,… • But also: • • genomic studies : recognizing orphan genes • • distant evolution studies Structure prediction: what for ? • Sequences diverge more than structures
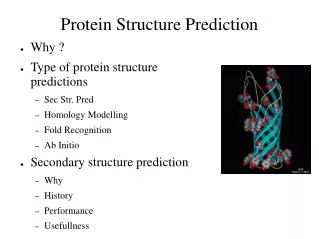
Methods for protein structural studies Known structures : Simulations at the atom level: molecular modelling (enthalpic energy) / molecular dynamics /normal modes
Methods for protein structural studies Unknown structures : Before using molecular mechanics, one must have a « realistic » structure. 3D structure prediction : 1) homology modelling 2) ab initio folding 3) threading
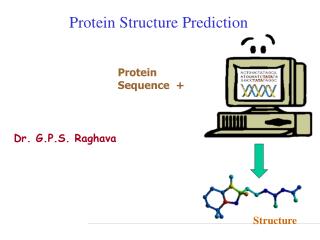
Homology modelling Needs to know a 3D structure that is homolog to the query sequence AGLNVIAGSILQNS GGINVLAASLLNNS e.g.: Modeller web server (http://www.salilab.org/modeller)
Homology modelling AGLNVIAGSILQNS GGINVLAASLLNNS e.g.: Modeller web server (http://www.salilab.org/modeller)
Ab initio folding Protein Data Bank (PDB) AGVLVAGHM Target sequence: generation AGV AGV LVA GHM AGV LVA AGV GHM LVA AGV LVA GHM LVA . . . GHM Minimisation - energy evaluation Baker et al.
Threading (1) Protein Data Bank (PDB) families
Threading (1) -------------- family core + interactions family Protein Data Bank -> library of cores
Threading (2) Protein Data Bank (PDB) Statistics for 3D neighboring residue pairs -> Energy A L = -1.2 A I = -2.2 ... Other characteristics: residue accessibility, secondary structure,…
Threading (3) core --------------
Threading (3) Thread the sequence onto the core V I = -2.3 L N = -4.2 L G = -5.1 GGINVLAGSLLNNS
Threading (3) Thread the sequence onto the core N G = -1.3 V I = -2.2 S A = -4.2 AGGINVLAGSLLNN
Threading (3) Thread the sequence onto the core I G = -3.3 N G = -3.0 G L = -2.1 LAGGINVLAGSLLN Compute energy for every alignment of the sequence onto the core (many alignments, gaps…) Thread the sequence onto all cores -> choose the best core (low energy)
Threading Can be used when sequence tools (BLAST or PSIBLAST) cannot find simlarities Threading methods are under developments :- optimisation of 3D alignments- better core definition- statistical assessment for results
Threading Robetta : http://robetta.bakerlab.org/3DPSSM : http://www.sbg.bio.ic.ac.uk/∼3dpssm/bioinbgu : http://www.cs.bgu.ac.il/∼bioinbgu/form.htmlGenTHREADER : http://bioinf.cs.ucl.ac.uk/psipred/psiform.htmlFROST :http://genome.jouy.inra.fr/frost/
A) La quantification des similarités des paires de structures (comparaison «~tout contre tout~») donne la position d'une structure dans un espace abstrait de hautes dimensions. La hauteur des pics reflète la densité de population de repliements, les axes horizontaux sont les axes des deux premiers vecteurs propres (i.e. associés aux deux plus grandes valeurs propres), l'axe vertical donne le nombre de repliements. La distribution des architectures est donnée par la projection sur le plan (la proximité sur ce plan donne une indication sur la similarité structurale entre 2 protéines) B) 40% de tous les domaines connus sont couverts par 16 classes de repliements. Ces 16 repliements sont montrés ici sous forme de diagrammes topologiques de structures secondaires dans la classe de leur attracteur (le numéro d'attracteur est le même que dans la figure A). Figures tirées de Holm et Sander (1996) "Mapping the protein universe"