Download
1 / 18
180 likes | 331 Views
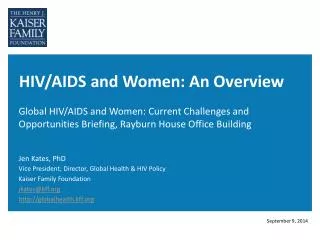
EPIDEMIOLOGIC CHARACTERISTICS OF HIV INFECTION AND AIDS AMONG WOMEN ONTARIO, 1981-2004. Robert S. Remis, Maraki Fikre Merid Department of Public Health Sciences University of Toronto Women and HIV Working Group Toronto, August 25, 2005. Methods: Data sources.

E N D
EPIDEMIOLOGIC CHARACTERISTICS OF HIV INFECTION AND AIDSAMONG WOMENONTARIO, 1981-2004 Robert S. Remis, Maraki Fikre Merid Department of Public Health Sciences University of Toronto Women and HIV Working Group Toronto, August 25, 2005
Methods: Data sources • HIV serodiagnostic data: First-time HIV positive diagnoses at HIV Laboratory, Ontario Ministry of Health and Long-Term Care (OMHLTC), 1985-2004 • Reported AIDS cases: Cases diagnosed to December 2003 and reported to Public Health Division, OMLTC by April 2004 • Laboratory Enhancement Study: Data used to adjust HIV diagnoses for unknown risk factors and previous HIV testing and to obtain estimates of HIV incidence (detuned assay)
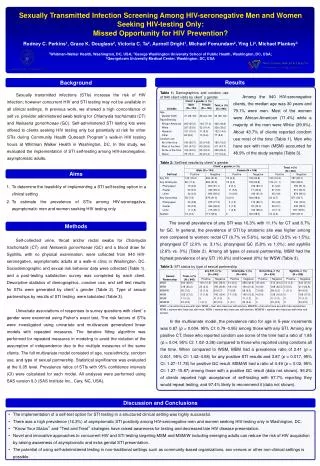
Number of first-time HIV diagnoses by sex and proportion female, 1985–2004 Dr. Robert S. Remis Public Health Sciences, University of Toronto
Males Females Total No. % No. % No. % MSM 16,382 77% 16,382 66% MSM-IDU 973 4.6% 973 3.9% IDU 1,410 6.6% 600 18% 2,010 8.1% Clot/trans 483 2.3% 219 6.4% 701 2.8% HIV-endemic 901 4.2% 1,120 33% 2,021 8.2% HR hetero 180 0.8% 683 20% 863 3.5% LR hetero 755 3.5% 559 16% 1,314 5.3% Other, peri 242 1.1% 228 6.7% 470 1.9% Total 21,325 100% 3,409 100% 24,734 100% Number and proportion of HIV diagnoses (adjusted) by exposure category and sex, Ontario, 1985-2003
HIV diagnoses among males (n=21,325)Ontario, 1985–2003 Dr. Robert S. Remis Public Health Sciences, University of Toronto
HIV diagnoses among females (n=3,409)Ontario, 1985–2003 Dr. Robert S. Remis Public Health Sciences, University of Toronto
HIV diagnoses for selected exposure categories among women, 1985–2004 Dr. Robert S. Remis Public Health Sciences, University of Toronto
Proportion HIV diagnoses in selected exposure categories among women, 1985–2004 Dr. Robert S. Remis Public Health Sciences, University of Toronto
Proportion Proportion Both sexes Males Females female Ontario Northern 365 258 107 29% 3.9% Ottawa 1,929 1,429 500 29% 18% Eastern Other 452 368 84 19% 3.0% Toronto 8,946 7,474 1,472 17% 53% Central East Other 785 583 202 26% 7.3% Central West 926 700 226 24% 8.1% Southwest 986 802 184 19% 6.6% Ontario 14,389 11,614 2,775 19% 100% HIV diagnoses by health region and sex, Ontario 1085-2003
Number of AIDS diagnoses by sex and proportion female, 1985–2004 Dr. Robert S. Remis Public Health Sciences, University of Toronto
Males Females Total No. % No. % No. % MSM 5,258 76% 5,258 70% MSM-IDU 299 4.3% 299 4.0% IDU 258 3.7% 78 14% 336 4.5% HIV-endemic 260 3.7% 156 28% 416 5.5% Hetero 414 5.9% 204 37% 618 8.2% Clot / trans 194 2.7% 59 11% 253 3.4% Other* 280 4.1% 54 10% 334 4.4% Total 6,963 100% 551 100% 7,514 100% * Other includes perinatal, occupational and NIR cases Number and proportion of AIDS cases by exposure category and sex, Ontario, 1981-2003
HIV Proportion HIV Proportion prevalence Ontario diagnosed diagnosed IDU 628 18% 433 69% HIV-endemic 1,041 30% 784 75% Heterosexual 1,743 51% 962 55% Clotting 5 0.1% 5 100% Transfusion 19 0.6% 19 100% Total 3,436 100% 2,203 64% Modeled HIV prevalence and diagnoses by exposure category, women in Ontario, 2003 Dr. Robert S. Remis Public Health Sciences, University of Toronto
Hetero Endemic IDU Other Total Northern 90 20 60 0 170 Ottawa 260 190 190 5 650 Eastern Other 90 20 60 0 170 Toronto 800 670 210 15 1700 Central East Other 180 60 40 5 280 Central West 170 40 40 0 250 Southwest 190 40 30 0 260 Ontario 1,780 1,040 630 25 3,500 Modeled HIV prevalence by health region and exposure category, women in Ontario, December 2003
Hetero Endemic IDU Other Total Northern 53% 12% 35% 0% 100% Ottawa 40% 29% 29% 1% 100% Eastern Other 53% 12% 35% 0% 100% Toronto 47% 40% 12% 1% 100% Central East Other 63% 21% 14% 2% 100% Central West 68% 16% 16% 0% 100% Southwest 73% 15% 12% 0% 100% Ontario 51% 30% 18% 1% 100% Modeled HIV prevalence, proportions (row %) by health region and exposure categoryWomen in Ontario, December 2003
Overview: Women / heterosexual • 1,780 HIV-infected women (51% of Ontario infections), 55% diagnosed • Toronto (45%); rest throughout Ontario Both sexes: • 1998-2003 HIV prevalence up 64% (annual 10%) • 2000 to 2004, HIV diagnoses increased 70%; increased in most regions but especially Central West (+202%), Southwest (+160%) and Toronto (+74%) • 320 new HIV infections in 2003 Dr. Robert S. Remis Public Health Sciences, University of Toronto
Overview: Women / HIV-endemic • 1,040 HIV-infected (30% of infections); 75% diagnosed • HIV prevalence approximately 0.8% • Most HIV-infected women in Toronto (64%) and Ottawa (18%) Both sexes: • 1998-2003 prevalence up 86% (annual 13%) • New HIV diagnoses increased 1999 (160) to 2002 (280) then decreased somewhat (230 in 2004) • 330 new HIV infections in 2003 (imported & Canada) Dr. Robert S. Remis Public Health Sciences, University of Toronto
Overview: Women / IDU • 630 HIV-infected (18% of Ontario infections), 69% diagnosed • HIV-infected women in Toronto (33%) and Ottawa (30%) Both sexes: • New HIV diagnoses stable overall past five years, though increase in 2004 in Southwest and Northern regions • HIV prevalence 5% (Ottawa 15%, elsewhere 4%) • 1998-2003 prevalence up 8% (annual 1.5%) • 80 new infections in 2003; HIV incidence 0.2% • Relatively reassuring Dr. Robert S. Remis Public Health Sciences, University of Toronto
Acknowledgements • Frank McGee, AIDS Bureau, Ontario Ministry of Health and Long Term Care (MOHLTC) • Maraki Fikre Merid, University of Toronto • Aida Rita Santiago, University of Toronto • Carol Swantee, HIV Laboratory, MOHLTC • Jane Njihia, FSO, PHAC / MOHLTC • Lorraine Schiedel, Public Health Branch, MOHLTC • CIDPC, Public Health Agency of Canada and Ontario HIV Treatment Network (OHTN) for funding the Laboratory Enhancement Study