Download
1 / 17
170 likes | 344 Views
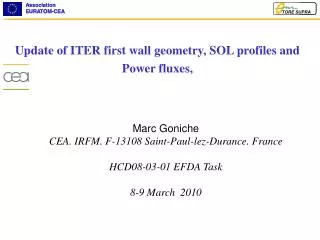
Update of ITER first wall geometry, SOL profiles and Power fluxes,. Marc Goniche CEA. IRFM. F-13108 Saint-Paul-lez-Durance. France HCD08-03-01 EFDA Task 8-9 March 2010. ITER First Wall (FW). Poloidal (18) limiter-like configuration at outer side to protect ports (and antennas)

E N D
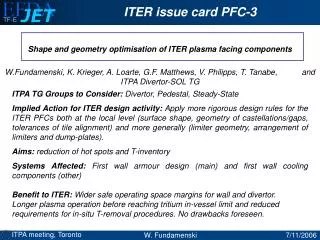
Update of ITER first wall geometry, SOL profiles and Power fluxes, Marc Goniche CEA. IRFM. F-13108 Saint-Paul-lez-Durance. France HCD08-03-01 EFDA Task 8-9 March 2010
ITER First Wall (FW) • Poloidal (18) limiter-like configuration at outer side to protect ports (and antennas) • Detachable FW from Blanket Modules • PFC technology not yet finalized From C.Lowry, IO,
Power flux on First Wall 2007 VSOL = 100m/s VSOL = 30m/s B2-EIRENE simulation + empirical extrapolation of mesurements (QDT=10) (A.Loarte, Nov.08) Te,FW = 10-20eV Ti,FW/Te,FW ~ 2 F//,FW=5MW/m-2 ne,FW = 0.5-1.5×10¹⁹m-3 VSOL < 100m/s =>lQ,farSOL=Lc VSOL/cs,SOL <0.17m
3D Field line tracing using CASTEM 2de sep FLFS ceiling BSM 11 banana-shaped far SOL region upper ceiling BSM contact points FLFS*-wall BSM 18 outboard BSM (not recessed) BSM log-shape [P.C. Stangeby, R. Mitteau] Reference plasma equilibrium, QDT = 10 burning phase (*FLFS : First Limited Flux Surface) (exaggerated shape)
Density profiles in the far SOL (2) High ne, low Te, long decay length ne = 1.5 1019 m-3, Te=10 eV, Ti = 2.Te Low ne, high Te, short decay length ne = 5 1018 m-3, Te=20 eV, Ti = 2.Te New reference scenario (∆R = 10cm) + Lc calculations with shaped wall Assuming λ = cst = 0.17m previous reference scenario (∆R = 5cm) + Lc calculations with smooth wall Assuming λ = cst = 0.04m Slightly different between BSM, see new presentation of S.Carpentier, to-morrow at CCIC => ne=2.6x10¹⁷m-3 1cm behind BSM (R-Rsep=0.20m) S.Carpentier, CCIC Dec.09,
Heat Fluxes to be considered for the LHCD antenna • Parallel Flux : conduction /convection • Perpendicular flux : • - Plasma radiation • - Charge Exchange (CX) • - Neutrons • - Fast ions • RF losses
Port, antenna 100 mm 100 mm Current shaping does not account for possible port plugs Rplasma = 8350 mm 100 mm C-modules, Port plug, antenna 100 mm flux surfaces every 10 mm Parallel heat flux of LHCD antenna ? F// < 5 exp-(30/50)=2.7MW/m2 (conductive) F// < 5 exp-(30/10)=0.3MW/m2 (convective) • Port plug should be 30-50mm behind FW • Field lines intercept port plugwith a~2.5° (40mrad)=> F<0.1MW/m2 From R.Mitteau, IO
Power e-fold decay length • lQ=(L// / (2pRq)n* lQ0 = (3/150)n * lQ0 • n=1/2 diffusion • n=1 convection • lQ = lQ0/ 7 (diff.) or 50 (conv.) • lQ0 = 0.05 – 0.17 m (far SOL) • lQ < 170/7 = 25mm (diff) • lQ < 170/50 = 4mm (conv)
30mm Toroidal view LHCD antenna shaping Poloidal view • Strong self-shadowing • V-shape in tor.direc. of the port-plug is highly recommended • Lower heat flux on FW by fast electrons
Parallel heat flux of LHCD antenna During ELMs ? t-riseELM = 250ms (sc.2) -550ms(sc.4) F//,ELM < 0.1MW/m2 , 3cm behind FW
Plasma radiation • Prad, FW /Ptot < 60% => P rad, FW /S = 70MW/683m2 • Peaking factor < 2 (<3 for MARFEs) • Radiation max near the bottom of the antenna X-point Top JET LH antenna 0.2 (sc.2) and 0.29 (sc.4) MW/m2
Power fluxes by CX • Estimated from B2-EIRENE code and empirical scaling of total plasma outflux => Large uncertainty • CX heat flux max near the outer mid-plane • Energy of neutrals : up to 1.6keV (sc.2)=> Sputtering (Be) 0.25 (sc.2) and 0.20 (sc.4) MW/m2 Prad + PCX < 0.5 MW/m2
lQ ~ 0.10m Power fluxes by neutrons 5MW/m3 • Maximumneutron wall load calculated using a 3D model22 yields 0.78 MW/m2 at the outboard side (fromNUCLEAR ANALYSIS REPORT (NAR) G 73 DDD 2 W 0.2, p19-20 & 24) • 5MW/m3 , lQ=0.1m (previously assumed) • Monte-Carlo neutron code required for exact calculation of the neutron damping in the antenna
Fast Ions dB/B =0.2% Kramer , IAEA2008 • Fusion born alpha particles lost due to the effect of the Magnetic Ripple amplitude • dB/B should be reduced with magnetic inserts to dB/B =0.2% • With toroidal field ripple only P <0.1MW/m2 (sc.4), <0.02MW/m2 (sc.2) • Computations have been done with a conservative value of 0.3MW/m2
RF losses • RF losses are maximum at mid-height of the large side of the WG • RF losses are modulated along propagation (RC 0) • Average loss depends on reflection R but also on the phase j of the reflected wave • Provided by coupling code • DDD2001 assumed 13 kW/m2 for Copper, 28 kW/m2 for Beryllium => needs to be up-dated • Should have a minor impact(PRFlosses,Be/Ptot ~5%)
Conclusion • Radiation/CX will not exceed 0.5MW/m2 • Decay length of this flux inside WGs is shortand needs to be accurately determined (Marfisi’s presentation) • Parallel heat flux on antenna front is negligible • Upper value for neutron heating source is taken to be 5MW/m3 • Fast ion flux should be precised ( ITER ripple) • RF losses are a small contribution to power loading of the antenna
Annex: Minimum heat flux for LH coupling ne=ncut-off=3x10¹⁷m-3, Te=15eV, sheath factor g=7 => F// = 0.2 MW/m2