Download

1 / 70

E N D
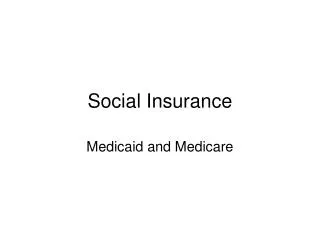
Social Insurance Medicaid and Medicare
Introduction • No longer will older Americans be denied the healing miracle of modern medicine. No longer will illness crush and destroy the savings that they have so carefully put away over a lifetime so that they might enjoy dignity in their later years. No longer will young families see their own incomes, and their own hopes, eaten away simply because they are carrying out their deep moral obligations to their parents, and to their uncles, and their aunts. ~President Lyndon Johnson
Medicaid • Social Insurance for the poor
Other Social Insurance Programs • State Children’s Health Insurance Program (SCHIP) • Veterans Administration
Crowding Out • When private insurance take up falls after introduction of increases in public benefits. • Concerns over public option.
HHS Estimates of Low-Income Subsidy Eligibility and Participation Under the Medicare Drug Benefit, 2008 Eligible but not receiving subsidy 2.6 million 21% Full dual eligibles automatically receiving subsidy Eligible but estimated to have other drug coverage .5 million 4% 6.2 million 49% Applied for and receiving subsidy 1.5 million 12% Future anticipated facilitated enrollment <0.1 million (0.5%) 1.7 million 13% MSP and SSI recipients automatically receiving subsidy Total Eligible for Low-Income Subsidies = 12.5 million NOTES: MSP is Medicare Savings Program; SSI is Supplemental Security Income. SOURCE: Kaiser Family Foundation, based on HHS data, January 31, 2008 ( Data as of January 2008).
Medicaid Today Health Insurance Coverage 29 million children & 15 million adults in low-income families; 14 million elderly and persons with disabilities Assistance to Medicare Beneficiaries 7.5 million aged and disabled — 19% of Medicare beneficiaries Long-Term Care Assistance 1 million nursing home residents; 41% of long-term care services MEDICAID Support for Health Care System and Safety-net 16% of national spending on health services and supplies State Capacity for Health Coverage 43% of federal funds to states Source: Kaiser Commission on Medicaid and the Uninsured, 2008
Medicaid’s Role for Selected Populations Percent with Medicaid Coverage: Families Aged & Disabled Note: “Poor” is defined as living below the federal poverty level, which was $17,600 for a family of 3 in 2008. SOURCE: Kaiser Commission on Medicaid and the Uninsured, Kaiser Family Foundation, and Urban Institute estimates; Birth data: NGA, MCH Update.
Medicaid Enrollees and Expendituresby Enrollment Group, 2005 Elderly 10% Elderly 28% Disabled 14% Adults 26% Disabled 42% Children 50% Adults 12% Children 18% Total = 59 million Total = $275 billion SOURCE: Kaiser Commission on Medicaid and the Uninsured and Urban Institute estimates based on 2005 MSIS data.
Medicaid Payments Per Enrolleeby Acute and Long-Term Care, 2005 $13,524 $11,839 $2,102 $1,617 SOURCE: Kaiser Commission on Medicaid and the Uninsured and Urban Institute estimates based on 2005 MSIS data.
Medicaid Enrollment Growth Average Annual Growth Rates, 2000-2006 Aged/Disabled Families SOURCE: Kaiser Commission on Medicaid and the Uninsured andUrban Institute estimates based on KCMU Medicaid enrollment data collected by Health Management Associates from 44 states inflated proportionally to national totals, 2007.
Overall Average Annual Total Medicaid Spending Growth, 2000-2006 Adjusted ‘05-’06 ‘00-’02 ‘02-’04 ‘04-’05 ‘05-’06 Annual Spending at End of Period (billions) $257.3 $295.9 $315.0 $314.5 $310.8 NOTE: Adjusted expenditures exclude all prescription drug spending for dual eligibles to remove the effect of their transition to Medicare Part D in 2006. SOURCE: Kaiser Commission on Medicaid and the Uninsured andUrban Institute, 2007; estimates based on data from HCFA Financial Management Reports, 2006 (HCFA-64/CMS-64).
Medicaid and SCHIP Enrollment of Children, 1998-2005 Millions of Children SOURCE: Kaiser Commission on Medicaid and the Uninsured and Urban Institute analysis of HCFA-2082, MSIS, and SEDS data, 2007.
Income and Health Status of Medicaid and the Low-Income Privately Insured, 2002 Percent of Enrolled Adults: Low-Income and Privately Insured Medicaid Poor Fair or Poor Health Health Conditions that limit work SOURCE: Coughlin et. al, “Assessing Access to Care Under Medicaid: Evidence for the National and Thirteen States,” Health Affairs 24(4):1073-1083. Based on a 2002 NSAF analysis for Kaiser Commission on Medicaid and the Uninsured.
Concentration of Health Spending in the Medicaid Population, 2001 <$25,000 in Costs 96% <$25,000 in Costs 52% >$25,000 in Costs • >$25,000 in Costs • Children (.2%) • Adults (.1%) • Disabled (1.6%) • Elderly (1.8%) Children 3% Adults 1% Disabled 25% Elderly 20% Total = 46.9 million Total = $180.0 billion SOURCE: Kaiser Commission on Medicaid and the Uninsured/Urban Institute estimates based on MSIS 2001 data.
Medicaid Expenditures by Service, 2006 DSH Payments 5.6% Inpatient 14.1% Home Health and Personal Care 14.8% Physician/ Lab/ X-ray 3.8% Mental Health 1.0% Outpatient/Clinic 6.8% Long-Term Care 35.8% ICF/MR 4.3% Acute Care 58.5% Drugs 5.5% Nursing Facilities 15.7% Other Acute 6.9% Payments to Medicare 3.3% Payments to MCOs 18.0% Total = $304.0 billion NOTE: Total may not add to 100% due to rounding. Excludes administrative spending, adjustments and payments to the territories. SOURCE: Urban Institute estimates based on data from CMS (Form 64), prepared for the Kaiser Commission on Medicaid and the Uninsured.
Medicaid in the Health System, 2006 Medicaid as a share of national health care spending: Total National Spending (billions) $2,106 $648 $660 $125 $217 NOTE: Does not include spending on SCHIP SOURCE: Kaiser Commission on Medicaid and the Uninsured, based on A Catlin et al, “National Health Spending in 2006: A Year of Change for Prescription Drugs,” Health Affairs 27(1)14-29, January/February 2008. Based on National Health Care Expenditure Data, CMS, Office of the Actuary.
Medicaid Financing of Safety-Net Providers Public Hospital Net Revenues by Payer, 2004 Health Center Revenues by Payer, 2006 Total = $29 billion Total = $8.1 billion SOURCE: Kaiser Commission on Medicaid and the Uninsured, based on America’s Public Hospitals and Health Systems,2004, National Association of Public Hospitals and Health Systems, October 2006. KCMU Analysis of 2006 UDS Data from HRSA.
National Spending on Nursing Home and Home Health Care, 2006 Nursing Home Care Home Health Care Total = $124.9 billion Total = $52.7 billion Note: Medicaid percentage includes spending through SCHIP. Other includes private and public funds SOURCE: Kaiser Commission on Medicaid and the Uninsured, based on Health Affairs January/February 2008, CMS, National Health Accounts.
Growth in Medicaid Long-Term Care Expenditures, 1990-2006 $109 In Billions: $100 $92 41% 37% 32% $75 30% $54 20% 59% $32 63% 70% 68% 13% 80% 87% Note: Home and community-based care includes home health, personal care services and home and community-based service waivers. SOURCE: Kaiser Commission on Medicaid and the Uninsured and Urban Institute analysis of HCFA/CMS-64 data.
Impact of Unemployment Growth on Medicaid and SCHIP and the Number Uninsured $3.4 $1.4 State 1.1 1.0 = 1% & Increase in National Unemployment Rate Federal $2.0 Increase in Medicaid and SCHIP Enrollment (million) Increase in Uninsured (million) Increase in Medicaid and SCHIP Spending (billion) Source: Stan Dorn, Bowen Garrett, John Holahan, and Aimee Williams, Medicaid, SCHIP and Economic Downturn: Policy Challenges and Policy Responses, prepared for the Kaiser Commission on Medicaid and the Uninsured, April 2008
IL State Authorized Children’s Eligibility for Medicaid/SCHIP by Income, January 2008 NH VT WA ME MT ND MN MA OR NY SD WI ID RI MI CT WY PA NJ IA NE OH IN WV DE NV IL UT VA MD CO KS MO KY CA NC DC TN OK SC AR AZ NM AL GA MS TX LA AK FL HI < 200% FPL (6 states) 200-250% FPL (22 states) Effective >250% FPL (23 states) *The Federal Poverty Line (FPL) for a family of three in 2007 is $17,170 per year. **Effective eligibility higher than 250% FPL accounts for earnings disregards. ***IL uses state funds to cover children above 200% FPL. SOURCE: Based on a national survey conducted by the Center on Budget and Policy Priorities for the Kaiser Commission on Medicaid and the Uninsured., 2008.
Authorized Medicaid Eligibility for Working Parents by Income, January 2008 NH VT WA ME MT ND MN MA OR NY SD WI ID RI MI CT WY PA NJ IA NE OH IN DE NV IL IL WV UT VA MD CO KS MO KY CA NC DC TN OK SC AR AZ NM AL GA MS TX LA AK FL HI < 50% FPL (12 states) 50% - 99% FPL (21 states) US Median Eligibility = 63% FPL 100% or higher FPL (18 states including DC) NOTE: The Federal Poverty Line (FPL) for a family of three in 2008 is $17,600 per year. AR, IN, & UT operate waivers allowing higher-income parents to enroll, but the coverage has higher cost-sharing and reduced benefits. SOURCE: Based on a national survey conducted by the Center on Budget and Policy Priorities for the Kaiser Commission on Medicaid and the Uninsured, 2008.
SOURCE: Based on a national survey conducted by the Center on Budget and Policy Priorities for the Kaiser Commission on Medicaid and the Uninsured, 2008. Nearly Two-Thirds of States Expanded Access to Medicaid and SCHIP, July 06 – January 08 Number of States With…
Community Hospital Payment-to-Cost Ratios, by Source of Revenue, 1980-2006 Note: Payment-to-cost ratios show the degree to which payments from each payer cover the costs of treating its patients. They cannot be used to compare payment levels across payers, however, because the service mix and intensity vary. Data are for community hospitals. Medicaid includes Medicaid Disproportionate Share payments. Source: American Hospital Association and Avalere Health, Avalere Health analysis of 2006 American Hospital Association Annual Survey data, for community hospitals, Trendwatch Chartbook 2008, Trends Affecting Hospitals and Health Systems, April 2008, Table 4.4, p. A-35, at http://www.aha.org/aha/trendwatch/chartbook/2008/08appendix4.pdf.
Medicaid Managed Care and Traditional Enrollment, 1990-2004 Enrollment (in millions) 44.4 42.7 40.1 36.6 33.7 33.4 33.6 33.4 33.2 31.9 32.1 30.9 30.9 28.3 25.3 Note: Numbers may not produce totals because of rounding. These figures represent point-in-time enrollment as of June 30 of each reporting year. Total Medicaid enrollment for 1996-2004 was collected by states at the same time the managed care enrollment numbers were collected, instead of using the CMS 2082 Medicaid data reporting system as in previous years. The unduplicated managed care enrollment data include enrollees receiving comprehensive benefits and limited benefits. This table also provides unduplicated national figures for the Total Medicaid population and Other population. The statistics also include individuals enrolled in State health care reform programs that expand eligibility beyond traditional Medicaid eligibility standards. Source: Kaiser Family Foundation, Trends and Indicators in the Changing Health Care Marketplace, 2002, May 2002, Exhibit 2.8, p.23, at http://www.kff.org/insurance/3161-index.cfm, using and updated with data from the Centers for Medicare and Medicaid Services, at http://new.cms.hhs.gov/MedicaidDataSourcesGenInfo/04_MdManCrEnrllRep.asp.
Enrollment (in millions) 42.5 41.9 41.2 40.5 40.1 39.7 39.2 38.9 38.5 38.1 37.6 37.0 36.3 35.6 34.9 34.3 Enrollment in Medicare Managed Care and Traditional Medicare, 1990-2005 Note: Total Medicare enrollment includes beneficiaries with HI and/or SMI coverage. Medicare managed care enrollment is enrollment in what Medicare calls CCPs (Coordinated Care Plans), which include health maintenance organizations (HMOs), provider-sponsored organizations (PSOs), and preferred provider organizations (PPOs). Source: Kaiser Family Foundation calculations using CCP enrollment data from the Centers for Medicare and Medicaid Services' monthly Medicare Managed Care Contract Reports for December 1 of each year, at http://www.cms.hhs.gov/HealthPlanRepFileData/04_Monthly.asp#TopOfPage (Zipped Monthly Summary (MMCC) Text Report, CCP plans), and total Medicare enrollment data from the 2006 Annual Report of the Boards of Trustees of the Federal Hospital Insurance and Federal Supplementary Medical Insurance Trust Funds, May 1, 2006, Table III.A3, p. 34, at http://www.cms.hhs.gov/ReportsTrustFunds/downloads/tr2006.pdf
Per Enrollee Growth in Medicare Spending and Private Health Insurance Premiums (for Common Benefits), 1970-2006 Notes: Per enrollee includes primary policy-holder plus dependents. Common benefits include hospital services, physician and clinical services, other professional services, and durable medical products; they exclude, for example, prescription drugs, home health care, non-durable medical products, and nursing home care. Source: Centers for Medicare and Medicaid Services, Office of the Actuary, National Health Statistics Group, Table 13, at http://www.cms.hhs.gov/NationalHealthExpendData/downloads/tables.pdf.
Cumulative Change in Family Health Insurance Premiums and Federal Poverty Level, 1996 - 2004 Source: Premium data from Agency for Healthcare Research and Quality, Medical Expenditure Panel Survey, 1996-2004, at http://www.meps.ahrq.gov/mepsweb/; Federal Poverty Level based on HHS Federal Poverty Guidelines (1996 through 2004) at http://aspe.hhs.gov/poverty/figures-fed-reg.shtml. Rate of growth based on change for one person (change for 4 person family would be 20.8% rather than 20.3% over the period).
American Public's Experience with Long-Term Care, 2007 At any time during the past 3 years, was a member of your immediate family or someone you know well receiving long-term care in a nursing home, at home, or in some other type of facility? Yes No Don’t know/ Refused Source: KFF Update on the Public’s Views of Nursing Homes and Long-Term Care Services (conducted October 1 – October 10, 2007)
Financial Burden of Health Spending Among Medicare Beneficiaries, 1997-2003 Median Out-of-Pocket Health Spending as % of Income Note: Difference between 1997 and 2003 is statistically significant at .05 level. Source: Kaiser/UCLA analysis of Medicare Current Beneficiary Survey Cost and Use files, 1997-2003.
Percent Change in Medicaid Spending and Enrollment, FY 2001-2008 Projected Notes: Enrollment percentage changes from June to June of each year. Spending growth percentage changes in state fiscal year. Source: KCMU survey of Medicaid Officials in 50 states and DC conducted by Health Management Associates, October 2007.
Distribution of the Increase in Uninsured Children, by Income, 2005-2006 400%+ FPL 150,000 21.2% 200-399% FPL 340,000 47.5% <200% FPL 220,000 31.3% 710,000 Uninsured Children Note: 200% to 399% of the federal poverty level (FPL) is roughly $40,000-$80,000 in annual income for a family of four in 2006. Source: KCMU/Urban Institute analysis of the March 2007 CPS.
Percent of Seniors Who Did Not Fill or Delayed Filling Prescriptions Due to Cost, by Source of Drug Coverage, 2006 (Among Non-Institutionalized Seniors Taking 1 or More Rx) NOTES: Did not fill or delayed filling prescriptions due to cost refers to within the past twelve months. VA is Department of Veterans Affairs. Reference group for statistical significance is Part D coverage (*p<0.05). SOURCE: Kaiser/Commonwealth/Tufts-New England Medical Center National Survey of Seniors and Prescription Drugs, 2006.
Distribution of Uninsured Children, 2004 Not Eligible >300% FPL Not Eligible <300% FPL Not Eligible on the Basis of Immigration Status 1.7 Million Eligible for SCHIP 5.4 Million Uninsured Children are Eligible but Unenrolled in SCHIP or Medicaid 3.7 Million Eligible for Medicaid 8 Million Uninsured Children SOURCE: Urban Institute analysis of the 2005 Annual Social and Economic Supplement to the CPS for KCMU. Data has been adjusted for the Medicaid undercount.
Medicare • Social Insurance for the elderly • Description 1965 • Medicare Part A, B, C,
Characteristics of the Medicare Population, 2006 Percent of total Medicare population: Income less than 200% FPL 3+ chronic conditions Cognitive/mental impairment Fair/poor health Less than high school education 2+ ADL limitations Under-65 disabled Age 85+ Long-term care facility resident NOTES: ADL is activity of daily living. The federal poverty (FPL) threshold for people age 65 and over was $9,669/individual and $12,201/couple in 2006.SOURCE: Income data from US Census Bureau, Current Population Survey published on statehealthfacts.org; all other data from Kaiser Family Foundation analysis of the Medicare Current Beneficiary Survey 2006 Access to Care file.
Medicare Enrollment, by Eligibility Status, 2001-2007 In millions: 44.0 43.0 42.5 41.7 41.1 41.0 40.1 SOURCE: Kaiser Family Foundation, based on Annual Report of the Boards of Trustees of the Federal Hospital Insurance and Federal Supplementary Medical Insurance Trust Funds, 2002-2008.
Medicare: Part A • Medicare Part A is a type of hospital insurance provided by Medicare. The coverage provided by Part A includes inpatient care in hospitals, nursing homes, skilled nursing facilities, and critical access hospitals. Part A does not include long-term or custodial care. If you meet specific requirements, then you may also be eligible for hospice or home health care. • Fiscal Intermediaries handle the claims for the Medicare Part A plan. These are private insurance companies that act as agents for the federal government in processing and paying Medicare claims.
Medicare Part A (Health Insurance) Trust Fund Balance, 2001-2019Under High Cost, Low Cost, and Intermediate Assumptions Fund balance as % of annual expenditures: Low cost ActualProjected Intermediate High cost NOTE: The Medicare Trustees recommend that the HI Trust Fund assets should be maintained at a level of at least 100% of annual expenditures. SOURCE: Kaiser Family Foundation, based on 2008 Annual Report of the Boards of Trustees of the Federal Hospital Insurance and Federal Supplementary Medical Insurance Trust Funds.
Medicare: Part B • Medicare Part B is a medical insurance provided by the federal government to eligible beneficiaries. The coverage provided by Part B includes medically necessary doctor's services, outpatient care, and most other services that Part A does not cover such as some physical or occupational therapies and some home health care services. Part B covers preventive services as well.
Medicare: Part C • Medicare Part C combines your Part A and Part B options and must cover all medically needed services. The difference is that private insurance companies that are approved by Medicare provide this type of coverage. In most cases, Part C is a lower-cost alternative to the Original Medicare Plan, and providers usually offer extra benefits and include prescription drug coverage (Part D). • Part C plans often have networks, and you must use the doctors or hospitals that belong to the plan. These plans help you coordinate and manage your overall care. Part C includes specialized care for people who need a large amount of health care services. If you find yourself needing medical attention while traveling out of your plan coverage area, you will still be covered for emergency or urgent care services.
Medicare: Part D • Prescription Drug Coverage • “Donut hole” $3,600* • * Changes by year • Part D is prescription drug coverage insurance that is provided by private companies approved by Medicare. You need to enroll when you first become eligible to keep from paying a penalty cost later. Part D was designed to help people with Medicare to lower their prescription drug costs and to protect against future costs. A prescription drug plan will also enable you to have greater access to medically necessary drugs.
Effects of Medicare: Part D • Shang and Goldman 2007 • Overall, a $1 increase in prescription drug spending is associated with a $2.06 reduction in Medicare spending. Furthermore, the substitution effect decreases as income rises, and thus provides support for the low-income assistance program of Medicare Part D.
Prescription Drug Coverage Among Medicare Beneficiaries, by Income, 2006 $10,000 or less $10,001-$20,000 $20,001-$30,000 $30,001-$40,000 $40,001 or more (N=6.4 mil) (N=9.4 mil) (N=7.0 mil) (N=5.7 mil) (N=6.7 mil) NOTES: Percents rounded to the nearest whole number. N=weighted estimate of number of beneficiaries; mil=million. SOURCE: Kaiser Family Foundation analysis of the CMS Medicare Current Beneficiary Survey Access to Care File, 2006.
HHS Estimates of Prescription Drug Coverage Among Medicare Beneficiaries, 2008 No Drug Coverage 4.6million10% Stand-Alone PDPs Other Creditable Drug Coverage1 11.2million25% 4.0million9% Total in Part D Plans: 25.4 Million (57%) 10.2million23% 6.2million14% Dual Eligibles in PDPs Retiree DrugCoverage2 8.0million18% Medicare Advantage Drug Plans3 Total Number of Beneficiaries = 44.2 Million NOTES: Estimates do not sum to 100% due to rounding. 1Includes Veterans Affairs, Indian Health Service, state pharmacy assistance programs, employer plans for active workers, Medigap, multiple sources, and other sources. 2Includes Retiree Drug Subsidy (RDS) coverage; retiree coverage without RDS; and FEHBP and TRICARE retiree coverage. 3Includes 0.4 million enrolled in other Medicare health plan types. PDP = Prescription Drug Plan. SOURCE: Kaiser Family Foundation analysis of HHS data, January 31, 2008 (Data as of January 2008).
Standard Medicare Prescription Drug Benefit, 2008 Plan Pays 15%; Medicare Pays 80% Enrollee Pays 5% $5,726 in Total Drug Costs($4,050 out of pocket) $3,216 Coverage Gap (“Doughnut Hole”) Enrollee Pays 100% $2,510 in Total Drug Costs Enrollee Pays 25% Plan Pays 75% $275 Deductible $320 Average Annual Premium NOTE: Annual premium amount based on $26.70 national average monthly beneficiary premium (CBO, March 2008). Amounts for premium, coverage gap, and catastrophic coverage threshold rounded to nearest dollar. SOURCE: Kaiser Family Foundation illustration of standard Medicare drug benefit for 2008 (standard benefit parameter update from CMS, April 2007).
Medicare Part D Enrollees Who Reached the Coverage Gap in 2007 Excludes Part D Enrollees Who Receive Low-Income Subsidies and Non-Users Did not reach the coverage gap Reached the coverage gap NOTES: Estimates based on analysis of retail pharmacy claims for 1.9 million Part D enrollees in 2007.SOURCE: Georgetown University/NORC/Kaiser Family Foundation analysis of IMS Health LRx database, 2007.
The Standard Medicare Part D Benefit Coverage Gap, 2006-2017 Amount of beneficiary out- of-pocket costs in the gap Actual Projected SOURCE: Kaiser Family Foundation, based on 2008 Annual Report of the Boards of Trustees of the Federal Hospital Insurance and Federal Supplementary Medical Insurance Trust Funds.