Download
1 / 21
210 likes | 241 Views
Explore the intertwined issues of low growth, inequality, and poverty in Latin America and strategies for pro-poor growth, fiscal challenges, and addressing inequality through efficiency and democratic legitimacy.

E N D
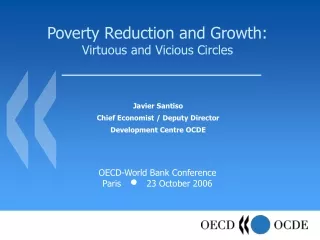
Poverty Reduction and Growth:Virtuous and Vicious Circles Javier Santiso Chief Economist / Deputy Director Development Centre OCDE OECD-World Bank Conference Paris 23 October 2006
I Poverty Reduction and Growth II Addressing Inequality Through Efficiency III Fiscal and Democratic Legitimacy IV Conclusions
Poverty Reduction and Growth in Latin AmericaWorld Bank Key Policy Messages • Latin America’s twin disappointments of low growth and persistent inequality and poverty have travelled hand in hand a long way • Without growth there is no poverty reduction, but poverty itself may hinder growth (e.g. it hinders access to credit and education) • Virtuous and vicious circles are possible • What is pro-poor growth? A pace and a pattern of growth that enhances the ability of poor people to participate in, contribute to and benefit from growth (DAC/POVNET) • The fiscal challenge • “Converting the state into an agent that promotes equality of opportunities and practices efficient redistribution is, perhaps, the most critical challenge Latin America faces in implementing better policies that simultaneously stimulates growth and reduce inequality and poverty”
Latin America is not closing the gap with richer countries, its growth is disappointing Source: based on Angus Maddison, Historical Statistics. The World Economy, Paris, OECD, 2003. Source: International Financial Statistics, IMF, 2006.
… while other regions are accelerating their converge processes with richer economies 6.0 6.0 5.0 5.0 1990 4.0 4.0 Mexico Brasil 2000/06 1980 3.0 1970 3.0 1950 1980 2.0 2000/06 2.0 1.0 1970 capita (% yearly) . 1.0 1950 GDP per capita Growth minus average world GDP per 1970 1990 capita (% yearly) . GDP per capita Growth minus average world GDP per 1980 1960 1990 0.0 0.0 1950 1950 -1.0 1960 China India -1.0 1970 1960 -2.0 1960 -2.0 1980 2000/06 -3.0 -3.0 2000/06 1980 -4.0 -4.0 -85 -75 -65 -55 -45 -30 -10 10 30 50 70 90 GDP Deviation (%) with respect to world average ($ 1990) GDP deviation (%) with respect to world average ($ 1990) Note: Annual growth (%) calculated as the average annual rate for the last six decades. Deviation (%) at the beginning of each decade. Source: OECD Development Centre, 2006. Based on Groningen Growth and Development Centre and The Conference Board, Total Economy Database, 2005
I Poverty Reduction and Growth II Addressing Inequality Through Efficiency III Fiscal and democratic legitimacy IV Conclusions
Income inequality continues to be a major challenge and disappointment in the region Inequality Indicators Source: WIDER Database, 2006. Source: World Development Indicators, 2006.
In the OECD inequality is reduced through taxation and social spending, but not in Latin America Gini – Market Income Gini –Disposable Income (after taxes and s. security) 0.60 0.60 0.55 0.55 0.50 0.50 0.45 0.45 0.40 0.40 0.35 0.35 0.30 0.30 0.25 0.25 0.20 0.20 Latin America European Union United States Spain Latin America European Union United States Spain Note: Gini coefficient calculated before and after taxes and transfers, illustrating their low incidence on inequality levels, in contrast with other regions. Source: The World Bank.
There is some evidence that more taxes might lead to quality public goods High quality Low quality
Strengthening fiscal effort might not be enough: Significant differences in Mexico/Brazil tax revenue TAX REVENUE AS PERCENTAGE OF GDP 2005 40 35 30 25 20 Percentage 15 10 5 0 OCDE Brazil Spain USA Colombia Chile Argentina Peru Mexico Venezuela Source: Eduardo Lora, Mauricio Cárdenas. “La reforma de las instituciones fiscales en América Latina”. Banco Interamericano de Desarrollo, Fedesarrollo, 2006. OECD, “Recent tax Policy trends and reforms in OECD Countries”, OECD.
Is more better? Tax revenue in Brazil is higher than economies of similar income level FISCAL BURDEN AND GDP PER CAPITA 0.45 Italy France 0.40 Brazil UK 0.35 Spain Germany Uruguay 0.30 0.25 Fiscal Revenue (% GDP) Nicaragua USA Honduras 0.20 Peru Mexico Bolivia Colombia 0.15 Argentina 0.10 0.05 0.00 4.5 5.5 6.5 7.5 8.5 9.5 10.5 11.5 Log(GDP per capita in current US dollars) Note: x-axis corresponds to the logarithm of the GDP per capita in current US dollars. Source: The World Bank, 2006.
Yet both Mexico and Brazil perform poorly in setting high health standards Health Indicators Note: Data from UNICEF and WHO adjusting by disease underreporting and classification errors. Source: OECD Development Centre, 2006. Based on: World Development Indicators, 2006.
More or better? And both perform poorly in attaining educational standards Percentage of Students on each performance level (Maths) Below level 1 Level 1 Level 2 Level 3 Level 4 Level 6 Level 5 Percentage of Students Alemania Éslovaquia Dinamarca Source: Based on PISA Report OCDE, 2003.
Performance is relatively poor even for the well-off Source: En base a Informe PISA, OECD, 2003
More is not better: At similar levels of expenditure it is possible to perform better SCHOOL PERFORMANCE AND EXPENDITURE - OECD 600 France 550 Finland Korea Netherlands Japan Switzerland Canada Czech Republic Germany Denmark Slovak Rep. Austria Irland Iceland Sweden 500 Hungary Norway Performance in Mathematics Spain USA Portugal Italy 450 Greece 400 Mexico 350 0 10 000 20 000 30 000 40 000 50 000 60 000 70 000 80 000 90 000 Accumulated expenditure per student primary and secondary school (US dollars) Source: En base a Informe PISA (OECD), 2003
I Poverty Reduction and Growth II Addressing Inequality Through Efficiency III Fiscal and democratic legitimacy IV Conclusions
Efficiency of fiscal institutions is key BUDGETARY INSTITUTIONS AND FISCAL RESULTS 2000-2002 0.05 Ecuador 0.04 Brazil 0.03 0.02 0.01 Venezuela Mexico Argentina Peru Budgetary Institutions Index (1-10) 0 0 1 2 3 4 5 6 Chile 7 8 9 Colombia -0.01 Guatemala Paraguay Uruguay -0.02 Nicaragua -0.03 Bolivia -0.04 -0.05 Primary results Government / GDP
A strong civil society improves tax collection Source: Civil society index is from the Glasius, Marlies, Mary Kaldor and Helmut Anheier (eds.) Global Civil Society Yearbook 2002 Global Civil Society 2002; tax revenue is from World Development Indicators, average 2000s, World Bank.
Because incentives and civil society involvement improve the quality of fiscal institutions Source: C. Santiso. “Auditing for accountability? Political economy of government auditing and budget oversight in emerging economies. Johns Hopkins University, 2006.
Ultimately we must realize that fiscal and democratic legitimacy go hand in hand Brazil Bolivia Uruguay Argentina Mexico Chile Peru Venezuela Nicaragua Costa Rica Colombia Paraguay Dominican Republic Guatemala El Salvador Source: Lora (2006) “El Futuro de los Pactos Fiscales en América Latina” mimeo IADB. Paper presented at the Economic Forum of the Iberoamerican Summit held in Barcelona 6-7 October 2006.
Conclusions • The problem does not lie on increasing taxes, but on improving the quality of social expenditure. • For this, fiscal institutionality needs to be enhanced, and incentives should be created to improve civil surveillance. • A pressing challenge consists on measuring and treating fiscal violence.