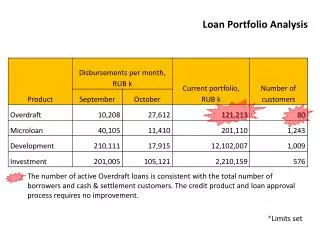
Download
1 / 16
170 likes | 400 Views
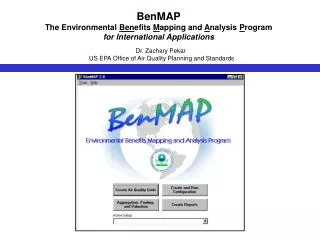
BenMAP The Environmental Ben efits M apping and A nalysis P rogram for International Applications. Dr. Zachary Pekar US EPA Office of Air Quality Planning and Standards. Environmental Benefits Analysis. Regulatory strategy to reduce emissions for specific category (effective 2020).

E N D
BenMAP The Environmental Benefits Mapping and Analysis Program for International Applications Dr. Zachary Pekar US EPA Office of Air Quality Planning and Standards
Environmental Benefits Analysis Regulatory strategy to reduce emissions for specific category (effective 2020) Predicted Control Scenario Ambient Air Concentrations in future simulation year (e.g., 2020) Monetary benefits from disease incidence reduction (COI and WTP) Reduction in health effects incidence (mortality and morbidity) Reduction in population-level exposure (acute and chronic) Predicted Baseline Ambient Air Concentrations in future simulation year (e.g., 2020) NOTE: BenMAP does output intermediate estimates of health effects incidence reductions for use in assessing public health impact and cost-effectiveness analysis
Environmental Benefits Analysis – Detailed Analytical Framework DISEASE INCIDENCE ESTIMATION Ambient air monitoring Local, regional-, national-level health surveillance data Grid-based air modeling Background disease incidence and prevalence (mortality, morbidity) Census data (projected for future simulation year) Ambient air quality change in simulation year Epidemiological studies Projected demographic (population count) data Change in health effect incidence (counts) for simulation year Concentration-response function VALUATION Willingness to pay (WTP) and cost of illness (COI) metrics (adjusted for income growth and elasticity) Monetized benefits for simulation year
BenMAP – Key Features and Capabilities • Currently designed to model criteria air pollutants (ozone and PM) • Key Features: • GIS-based analytical framework that can accept different spatial templates. • Flexibility to work with range of air quality, demographic and disease incidence databases and variables. • Supports spatial interpolation of air quality data using monitored (measured) and modeled estimates (excludes kriging functionality) • Supports use of customized concentration-response (CR) functions. • Key Capabilities: • Generates population-level exposure surfaces. • Produces range of health incidence estimates (mortality and morbidity). • Generates monetized (valuation) results based on health incidence reductions. • Supports probabilistic (Monte Carlo simulation-based) uncertainty characterization for health incidence and valuation functions.
BenMAP – Key Model Elements Mapping and data export functions BenMAP (MAIN SCREEN) Access to Setups (user-defined parameterizations for specific analyses) (2) Health effects incidence estimation (mortality and morbidity) (1) Developing/importing air quality grids (baseline and control) (4) Creating reports with health effects and/or valuation results (3) Valuation (monetizing health effects incidence estimates)
BenMAP – Setup Screen The Setup Screen provides the user with a high degree of flexibility in importing data specific to a given scenario Specify spatial templates (map structure) for analysis (includes raster and vector options)
BenMAP – Create Air Quality Grids Screen • Methods for generating air quality grids (baseline and control) • Model direct (import model grids – vector or raster) • Monitor direct (spatial interpolation of monitor point data) • Monitor rollback (percent, incremental, “to-standard” rollback of monitor data with interpolation) • Model and/or monitor relative (spatial interpolation using combination of monitor and model data)
BenMAP – Create Air Quality Grids– Monitor Direct Option Monitor direct EXAMPLE – spatial interpolation of monitor data using nearest neighbor, or Voronoi neighbor averaging (VNA) Additional windows
BenMAP – Create and Run Configuration Screen CR function selection screen (within the Create and Run Configuration window) – user specifies the set of mortality and/or morbidity functions that they want to include in the analysis (as well as the baseline and control air quality grids, simulation year and pollutant type). Available CR functions Additional windows CR functions selected by user for analysis
BenMAP – Aggregation, Pooling and Valuation Screen Aggregation and pooling screen (within the Aggregation, Pooling and Valuation window) – user specifies how they want the incidence results generated in previous step aggregated and/or pooled. Incidence results generated in previous step Flexible database structure to support aggregation and pooling
BenMAP – Aggregation, Pooling and Valuation Screen Valuation screen (within the Aggregation, Pooling and Valuation window) – user specifies valuation functions to use in monetizing incidence reductions. Available valuation functions Work area for specifying valuation function(s) for each modeled incidence category (includes aggregation/pooling functionality)
BenMAP – Create Reports Screen • Create Reports screen – User can generate variety of reports (see GUI below) Different categories of results to review Note: The Audit Trail Report Option provides full record or all options selected/specified in running BenMAP International for a specific scenario – this provides complete transparency for model runs. Options for specifying descriptive variables to include in report
BenMAP – Applications • Potential Applications: • Design emissions control scenario for specific source category – compare multiple scenarios to identify optimal strategy (air quality model resource issues). • Compare multiple emissions sources to guide priority setting for regulatory planning. • Evaluate significance of public health impact for particular pollutant and/or population(s) – monitor rollback (incremental, percent, or rollback to standard).
BenMAP – Release of Version 2.0 • BenMAP International Version 2.0 • First open-distribution version scheduled for completion in Winter 2004. Software available Winter 2004 or Spring 2005. • Range of enhancements: (a) multi-chemical modeling, (b) dynamic linking of internal databases to increase ease of use, and (c) enhanced GUI design to improve user-accessibility. • Expanded and improved user manual in PDF format to be included with the model (includes case studies with matching datasets to enhance self-directed learning) • US Domestic version of BenMAP (model and manual) available at: http://www.epa.gov/ttn/ecas/benmodels.html • Contact Information for BenMAP International • Dr. Zachary Pekar • Human health risk assessment • USEPA, Office of Air Quality Planning and Standards • Phone: (919) 541-3704 • e-mail: pekar.zachary@epa.gov