Understanding Inventory Management: Types, Models, and Cost Control
This chapter delves into the fundamentals of inventory management, explaining the various types of inventories—raw materials, work in progress, and finished goods. It differentiates between independent and dependent demand and emphasizes the importance of inventory control systems to optimize stock levels and minimize costs. The text discusses significant inventory models, including the Economic Order Quantity (EOQ) and the ABC classification system, and covers crucial concepts like holding costs, ordering costs, and the objective of maintaining customer service levels while managing inventory expenses.

Understanding Inventory Management: Types, Models, and Cost Control
E N D
Presentation Transcript
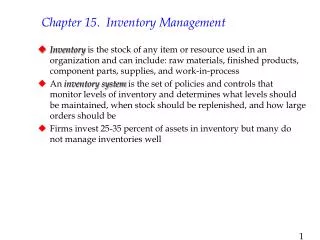
Chapter 11Inventory Management Pencils, papers, clips, advertisements-flyer, visiting cards, nuts, bolts, trucks, needles, airplanes Raw materials, semi-finished goods, finished goods What is the worth? Let top management see the money withheld
Inventory- a stock or store of goods Independent Demand A Dependent Demand B(4) C(2) D(2) E(1) D(3) F(2) Independent demand is uncertain. Dependent demand is certain.
Independent demand – finished goods, items that are ready to be sold E.g. a computer Dependent demand – components of finished products E.g. parts that make up the computer Inventory Models
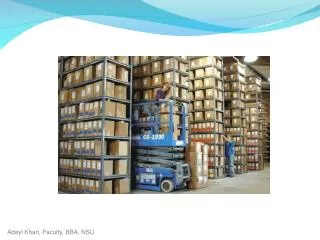
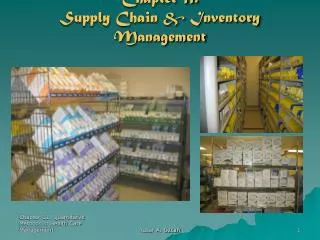
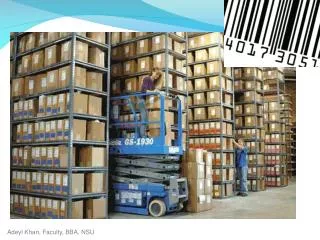
Raw materials & purchased parts Partially completed goods called work in progress Finished-goods inventories manufacturing firms retail stores (merchandise ) Replacement parts, tools, & supplies Goods-in-transit to warehouses or customers Types of Inventories
To meet anticipated demand Anticipation stock To smooth production requirements Seasonal demand (e.g. Potato case!) To decouple operations Buffer for continuous operation To protect against stock-outs Delayed delivery, abrupt demand Safety stocks Functions of Inventory
To take advantage of order cycles Purchasing, Producing in Batches (Lots) Cycle stock for periodic To help hedge against price increases Oil price To permit operations Intermediate Stocks (WIP) Pipeline inventory To take advantage of quantity discounts Functions of Inventory (Cont’d)
To achieve satisfactory levels of customer service while keeping inventory costs within reasonable bounds Level of customer service Costs of ordering and carrying inventory Inventory turnover Ratio of average cost of goods sold to average inventory investment. Days of inventory on hand Objective of Inventory Control
A system to keep track of inventory (and S.O.) A reliable forecast of demand Knowledge of lead times (and variability) Reasonable estimates of Holding costs Ordering costs Shortage costs A classification system Effective Inventory Management
Periodic System Physical count of items made at periodic intervals Small Retailers- checks and orders replenishment Perpetual Inventory System Keeps track of removals from inventory continuously, thus monitoring current levels of each item Reorder point Q Also requires periodic counting Errors, pilferage, spoliage Inventory Counting Systems Cost?
Inventory Counting Systems … • Two-Bin System - Two containers of inventory; reorder when the first is empty • 2nd cart has enough inventory for the lead time • Order card • Universal Bar Code - Bar code printed on a label that has information about the item to which it is attached
Lead time: time interval between ordering and receiving the order Holding (carrying) costs: cost to carry an item in inventory for a length of time, usually a year Ordering costs: costs of ordering and receiving inventory Shortage costs: costs when demand exceeds supply Key Inventory Terms
The Inventory Cycle- Figure 12.2Profile of Inventory Level Over Time Q Usage rate Quantity on hand Reorder point Time Place order Receive order Receive order Receive order Place order Lead time
Classifying inventory according to some measure of importance and allocating control efforts accordingly. A - very important B - mod. important C - least important High A Annual $ value of items B C Low Low High Percentage of Items ABC Classification System Example 1- P 549
A physical count of items in inventory Cycle counting management How much accuracy is needed? When should cycle counting be performed? Who should do it? Cycle Counting
Economic order quantity (EOQ) model The order size that minimizes total annual cost Economic production model Quantity discount model Economic Order Quantity Models
Q D S H + 2 Q Total Cost* Annual carrying cost Annual ordering cost Total cost* = + TC =
Cost Minimization Goal- Figure 12.4C The Total-Cost Curve is U-Shaped Annual Cost Ordering Costs Order Quantity (Q) QO (optimal order quantity) Minimum Total Cost
Using calculus, we take the derivative of the total cost function and set the derivative (slope) equal to zero and solve for Q. Minimum Total Cost The total cost curve reaches its minimum where the carrying and ordering costs are equal. Q D S H = 2 Q Deriving the EOQ
Economic Production Quantity (EPQ) • Production done in batches or lots • Capacity to produce a part exceeds the part’s usage or demand rate • Similar to EOQ • Orders are received incrementally during production
Economic Run Size We do not buy the product. We produce it. Total demand / year is D Demand / day or consumption rate is u Production rate is p / day
Instantaneous Replenishment Incremental Replenishment
EPQ: Incremental Replenishment(Production and Consumption) Demand / day or consumption rate is u Production rate is p / day p-u p u u × ( number of working days ) = D = Total demand per year
EPQ: Ordering Cost and Carrying Cost State Imax in terms of Q!
I max p-u u d2 d1 EPQ : Production & Consumption; rate & time How much do we produce each time? Q How long does it take to produce Q? d1 What is our production rate per day? p How long does it take to consume Q? d1 +d2 What is our consumption rate per day ? u
Example- What is the optimal production size? • A toy manufacturer • Uses 48000 parts for one of its products. • Consumption rate is uniform throughout the year. • Working days are 240 / year. • The firm can produce at a rate of 800 parts / day • Carrying cost is $1 / part / year • Setup cost for production run is $45 / setup
I max p-u u d2 d1 What is Run Time, What is Cycle Time Q0 using formula = 2400 u = 48000 /240 = 200 units/day
ROP • If setup time takes 2 days, at which level of inventory we should start setup? • 2(200) = 400
YAE • A company has a yearly demand of 120,000 boxes of its product. The product can be produced at a rate of 2000 boxes per day. The shop operates 240 days per year. Assume that demand is uniform throughout the year. Setup cost is $8000 for a run, and holding cost is $10 per box per year. • a) What is the demand rate per day • b) What is the Economic Production Quantity (EPQ) • c) What is the run time • d) What is the maximum inventory • e) What is the total cost of the system
YAE … • What is the demand rate per day • Demand per year is 120,000 there are 240 days per year • Demand per day = 120000/240 = 500 • u = D/240 = 500 • b) What is the Economic Production Quantity (EPQ) =16000
YAE … • c) What is the run time • We produce 16000 units • Our production rate is 2000 per day • It takes 16000/2000 = 8 days • d1 = EPQ/p = 8 days • d) What is the maximum inventory • We produce for 8 days. Each day we produce 2000 units and we consume 500 units of it. Therefore we add to our inventory at rate of 1500 per day for 8 days. That is • Imax = 8(1500) = 12000 • Imax = pd1 = 8(1500) = 12000
YAE … • e) What is the total cost of the system
Annual carrying cost Annual ordering cost Purchasing cost + TC = + Q D PD S H TC = + + 2 Q Total Costs with Purchasing Cost
Cost Adding Purchasing costdoesn’t change EOQ TC with PD TC without PD PD 0 Quantity EOQ Total Costs with PD- Figure 12.7
TCa TCb Total Cost Decreasing Price TCc CC a,b,c OC EOQ Quantity Total Cost with Constant Carrying Costs - Figure 12.9
Total Cost with Variable Carrying Costs Fig 11.9 Do the Math Ex 5- P 501 Do the Math Ex 6- P 504
When to Reorder with EOQ Ordering • ROP • Safety Stock - Stock that is held in excess of expected demand due to variable demand rate and/or lead time. • Service Level - Probability that demand will not exceed supply during lead time.
The rate of demand The lead time Demand and/or lead time variability Stockout risk (safety stock) Determinants of the Reorder Point
Quantity Maximum probable demand during lead time Expected demand during lead time ROP Safety stock Time LT Safety Stock- Figure 12.12 Safety stock reduces risk of stockout during lead time
Reorder Point- Figure 12.13 See also: Fig 11.14 The ROP based on a normal Distribution of lead time demand Service level Risk of a stockout Probability of no stockout Quantity ROP Expected demand Safety stock 0 z z-scale ROPs = Exp. Demand + z. σdLT
Shortage and Service Level • Service level determines ROP • E(n) = E(z) z σdLT • E(n) = Expected number of short/cycle • E(z) = Standardized number of units-short from table 11.3 • σdLT= Standard deviation of lead time • Example 10 @ Page 509
Orders are placed at fixed time intervals Order quantity for next interval? Suppliers might encourage fixed intervals May require only periodic checks of inventory levels Risk of stockout Fill rate – the percentage of demand filled by the stock on hand Fixed-Order-Interval Model
Calculations Ex 13 @ P 512
Single Period Model • Model for ordering items with limited useful lives • Perishables • Shortage cost is generally the unrealized profits per unit • Excess cost is the difference between purchase cost and salvage value of items left over at the end of a period
Ce Cs Service Level Quantity So Balance point Cs Cs + Ce Service level = Optimal Stocking Level Cs = Shortage cost per unitCe = Excess cost per unit
Ce = $0.20 per unit Cs = $0.60 per unit Service level = Cs/(Cs+Ce) = .6/(.6+.2) Service level = .75 Ce Cs Service Level = 75% Quantity Example 15 Stockout risk = 1.00 – 0.75 = 0.25